7.1 人类长寿的起源
回想一下第三章,在果蝇中使用人工选择的实验室结果与彼得·梅达瓦尔提出的寿命进化理论和W·D·汉密尔顿的数学理论一致。类似的实验无法在人类身上进行。因此,我们必须寻找其他非侵害性的(noninvasive)方法来证实长寿的进化理论。新兴的生物人口统计学(biodemography,将生物学和人口学相结合的科学)为研究人类特有的长寿起源提供了方法。生物人口统计学主要是一门数学和理论科学,它构建模型来预测人类寿命的起源。这些数学模型将死亡率分析的原理与考古学、体质人类学、遗传学和进化论等科学领域的实验观察相结合。
在本节中,我们将通过生物人口统计学来探讨人类长寿的起源及其对寿命的影响。我们从一些通用的生物人口统计学的原理开始,这些原理指导了预测人类寿命起源模型的开发。这些原理使我们得出了一个新的理论,即人类长寿的起源在不同物种中可能是独特的,反映了我们优越的智力和操纵环境的能力。
人类死亡率是临时性的
在简单的真核生物和啮齿类动物身上进行的分子和细胞观察使我们能够相当精确地区分衰老、长寿以及与年龄相关的疾病之间的差异。在动物身上进行的高度受控的实验结果显示,所谓长寿就是为了选择存活到生殖年龄的基因的副产品(见第3章)。使用类似的实验室技术,研究人员观察到,另一种衡量寿命的指标,即平均寿命,似乎与发育过程中偶然发生的随机或随机效应更加密切相关。因此,我们已经能够将长寿定义为特定物种的最大年龄潜能,将寿命定义为由物种内个体生命长度。
生物人口统计学学科中的人类死亡率研究无法轻易地将遗传的内在死亡率与环境依赖的外在死亡率区分开来(关于衰老背景下的“内在”和“外在”死亡率的讨论,见第2章)。影响人类寿命的环境因素不应被孤立。在关于人类长寿起源的生物统计预测中,由于年龄相关疾病或环境因素导致的人类死亡在数学上得到了解释。也就是说,生物统计学家在他们的数学模型中将环境因素视为关键变量。人类通过认知推理对环境变化做出反应,而不是简单地凭本能做出反应。人类可以改变环境以满足他们的需求,这种操作引起了智人特有的死亡和寿命特征。
人类操纵环境的能力反映了生物人口统计学最重要的原则之一:死亡率是偶发的。生物人口统计学中使用的“偶发”一词是指环境影响导致死亡率或死亡率轨迹具有显著的可塑性。也就是说,死亡率不是固定的,就像Gompertz分析预测的那样(见第2章)。这种可塑性源于这样一个事实,即影响人类个体死亡率的环境条件差异是无限的,并且在不断变化。尽管总体人口死亡率可能呈现特定的Gompertz死亡率模式,但亚群的死亡率将有显著差异。许多生物统计学家认为,这些亚群对人类长寿的起源产生了重大影响。
我们可以用历史人口出生季节变化的例子来证明死亡率的偶发性及其对长寿的影响(图7.1)。在营养等条件最好的时期出生的婴儿,即秋收期间和秋收后的几个月(北半球,9月至12月),比在冬季出生的婴儿寿命更长,因为冬季最有可能出现粮食短缺(1月和2月)。这种简单的相关性表明,生命早期的环境因素已经建立了多个死亡率不同的亚群。由于在收获月份出生的婴儿死亡率较低,这些亚群的健康度更高,对寿命和/或长寿的影响更大。
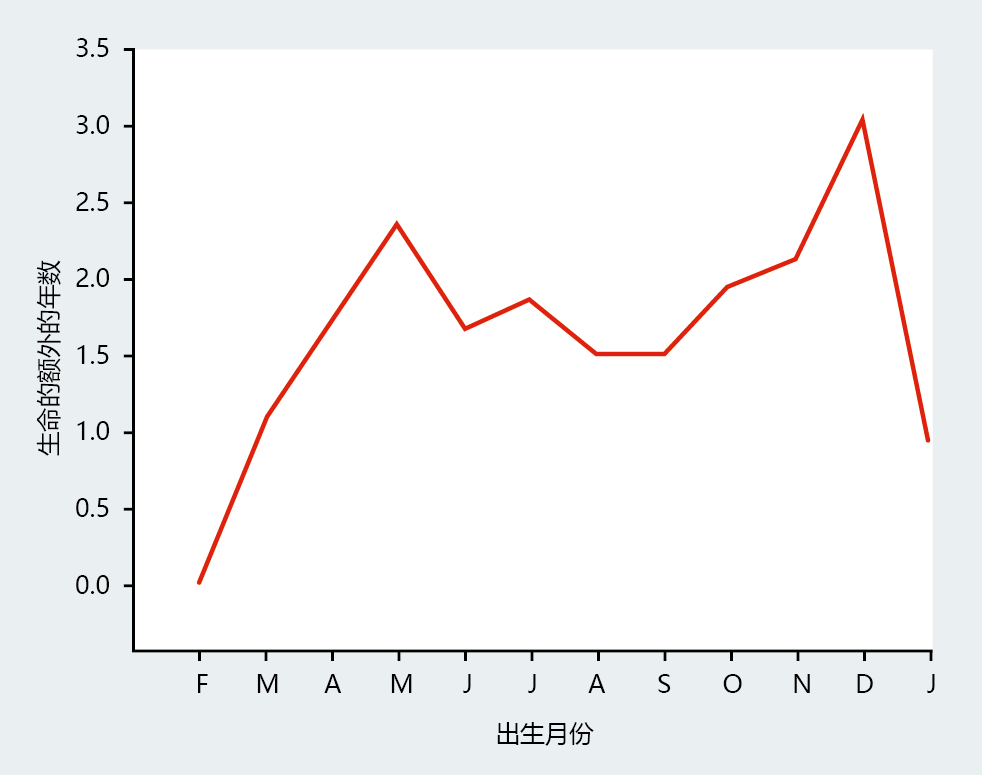
图7.1 不同月份出生的女孩寿命增加的生物统计预测。研究表明,寿命的差异可能反映了出生时营养因素的差异。这些结果是通过对1800年至1880年间在欧洲国家出生的6908名30岁以上妇女的寿命进行回归分析得出的。(摘自洛杉矶Gavrilov,NS.2003。调节衰老和长寿[SSL.Rattan,ed],Dordrecht,Netherlands:Kluwer学术出版社。经Springer科学公司许可。)
遗传因素导致人类死亡率具有明显的可塑性
人类死亡率是高度可变的,即使在数学或统计上控制了与年龄相关的疾病和环境影响的混杂因素后,这种可变性仍然存在。此外,生物形态学(biode-mographic)研究表明,总体人类死亡率包含了各种离散的个体亚群的死亡率,它们共享特定的Gompertz死亡率,该死亡率与整个人群的死亡率不同。总之,非环境变因素和离散亚群死亡率有力地表明,影响人类寿命的遗传因素也具有可塑性,并且是不固定的。(死亡率遗传可塑性的实验证据在第2章中进行了讨论。)对地中海果蝇的研究表明,晚年死亡率通过趋于平稳然后减速而偏离Gompertz比率(见图2.19)。这种晚年死亡率的差异通常被认为意味着种群中存在不同的长寿基因型。生物统计学家认为,这些不同的基因型可能存在于整个进化史上,并可能在决定人类寿命的基因选择中发挥作用。
遗传可塑性对死亡率的影响为生物统计学家预测人类长寿的起源提供了进化基础。想象一下,一个早期人类群体具有足够的遗传可塑性,可以产生不同的死亡率。这个群体将包含一个在生殖寿命结束前死亡的亚种群,另一个极端是一个远远超过生殖寿命结束的亚种群。长寿亚种群的生殖寿命越长,其适应性就越强,尽管仅略高于寿命较短的亚种群。随着进化时间的推移,产生寿命较长、繁殖期较长的亚种群的基因型的基因将被选择,而不是产生寿命较短的群体的基因型。(参见第3章中关于基因漂移和突变积累的讨论。)人类基因组本来会朝着延长寿命的方向漂移,而且仍将漂移。
长寿人群的死亡率各不相同
在过去,我们想搞清楚遗传因素导致的寿命最长的人类死亡率差异的可能性是很困难的,因为没有足够的人达到高龄。死亡率差异的证据通常仅限于那么几个达到高龄的个体。然而,今天,世界各地正在进行几项科学研究,探索长寿人群(通常定义为100岁以上的人——百岁老人)的遗传学与寿命之间的关系。(在美国,100岁以上的人数在10万至20万之间。)在本章的后面,我们简要介绍了对百岁老人的研究,在这些研究中,与极端长寿相关的染色体位置正在被确定。
我们通过评估百岁老人的兄弟姐妹或双胞胎的死亡率来调查基因对人类寿命的影响。百岁老人的兄弟姐妹或双胞胎极有可能具有相似的基因图谱,基因图谱提供了人口统计学证据,表明长寿可能与遗传有关。这些类型的研究结果表明,百岁老人的兄弟姐妹或双胞胎的存活概率和死亡率与普通人群的死亡率有显著差异。例如,新英格兰百岁老人研究发现,百岁老人的女性和男性兄弟姐妹达到100岁的可能性分别是普通人群的8倍和17倍。同一项研究表明,在整个寿命的所有年龄段,百岁老人的兄弟姐妹的死亡率大约是整个美国观察到的死亡率的一半(图7.2)。尽管仍需要大量研究来证实人类长寿的遗传成分,但基因似乎在决定长寿方面发挥着重要作用。
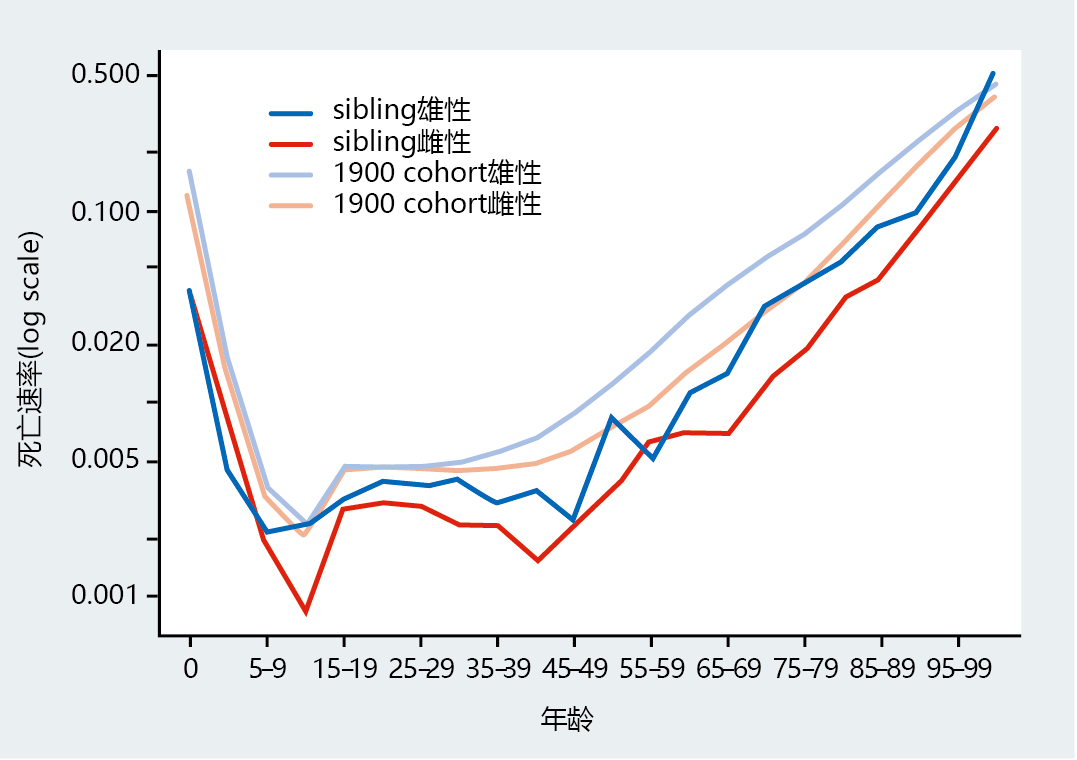
图7.2 自1900年出生的百岁老人兄弟姐妹的按性别划分的年龄死亡率。这些数据表明,百岁老人的兄弟姐妹在所有年龄段的特定年龄死亡率都明显低于1900年出生的美国普通人群。(具体年龄死亡率斜率变化的解释见图2.15。)(来自Perls TT等人,2002年。Proc。美国国家科学院院刊. 99:8442–84472002。经美国国家科学院批准。)
通过全基因组的关联研究确定了与人类长寿复杂的特征相关的基因
人口研究表明,百岁老人在人群中代表着一种独特的表型,这自然会让人联想到评估一般人群和百岁老人之间可能存在的遗传基因组差异。为此,全基因组关联研究 (GWAS) 被用来识别百岁老人和普通人群之间的遗传差异 (见方框 7.1)。GWAS 利用微阵列技术(见第 5 章)来识别染色体上可能与复杂性状(受到多个基因和强烈的环境影响的表型)相关的基因位置。GWAS 识别与复杂性状相关的基因的用处依赖于遗传学的一个原理,该原理认为染色体上彼此靠近的基因会一起遗传,并且通常参与类似的功能。因此,识别染色体上特定位置的一个基因就意味着定位同一基因座的其他几个基因 (方框 7.1)。
|
框7.1 全基因组关联研究 |
|
全基因组关联研究将多个染色体位置与疾病和复杂表型联系起来。 人类基因组中大约有20000个蛋白质编码基因(译者注:最新的研究发现大约3到5万个基因,不止2万)和数百万个不编码蛋白质的DNA序列,但它们在确保转录和翻译顺利进行方面发挥着重要作用。即使是DNA的一个碱基对序列的改变也可能会改变蛋白质的结构,进而导致表型的改变,在某些情况下甚至还会导致疾病。自从Watson和Crick描述了DNA的结构以来,将特定的人类表型或疾病与基因联系起来的遗传学研究一直是遗传学和生物医学研究的中心主题。然而,自Watson和Crick的DNA双螺旋提出到现在的64年里,只有少数人类基因被证明是致病基因。此外,在本书出版时,对于基因与复杂的性状、表型或涉及多个染色体位置的疾病的匹配仍然不明确。鉴于过去50年来我们在遗传学领域的进步,为什么要将人类基因与复杂的性状和疾病相匹配如此困难? 这个问题的答案很可能反映了与人类遗传学研究相关的两个问题:(1)对人类进行遗传学研究的实验限制和(2)对基因型与表型关系的新理解。至于前者,实验室动物中用于评估与长寿等复杂性状相关基因的许多实验技术对人类来说过于伤害。人们不能通过插入或删除基因来直接测试与人类表型或疾病的遗传联系。用于评估基因对人类表型和疾病的贡献的方法必须是间接的和非伤害性的。 基因型和由此产生的表型之间一对一关系的普遍观点不再能得到实验证据的支持。一个基因对应一个表型的概念似乎仅限于具有灾难性、致命性或两者兼有的巨大影响的性状。例如,单个基因cftr和wrn的改变分别是囊性纤维化和早衰症的专属和必要的。其实,绝大多数表型都是复杂的性状,是位于几个染色体上的数百个基因的结果,每个基因都产生较小的影响。眼睛的颜色似乎涉及整个基因组中100-200个基因。研究复杂性状的遗传贡献需要实验方法能够同时识别几个基因的位置。 全基因组关联研究(GWAS)符合探究人类复杂特征的标准,因为它们具有微创性,只需要几个细胞,并且能够同时识别多个染色体位置。此外,GWAS使用整个基因组来搜索与复杂性状相关的染色体位置,这比之前广泛使用的候选基因方法(candidate gene approach)有了巨大的改进。候选基因是怀疑与特定疾病或复杂性状有关的单个染色体区域内的DNA序列或基因。候选基因是通过还原论方法选择的,也就是说,可疑的单个基因,通常是实验室动物中鉴定的基因的人类同源物/直系同源物,必须一次一个地测试它们是否参与了复杂的性状。因此,候选基因方法是耗时的,并且通常只有当表型或疾病是一个具有重大影响的基因改变的结果时才有价值。 在过去十年GWAS之所以成为可能,是因为如下原因:(1)低成本的全基因组测序;(2)分析超大数据集所需的计算机能力和统计方法;以及(3)遗传学家、数学家和计算机科学家之间的非传统科学合作。如果遗传学研究环境中的这些变化听起来很熟悉,那么你已经认识到GWAS代表了一种将人类遗传学带入精确医学领域的方法(框 2.2)。你在这里了解到,GWAS正在帮助医学遗传学从一个几乎只关注罕见或灾难性疾病遗传学的领域转变为一个更常见的慢性病和其他复杂特征可能与特定基因相关的领域。GWAS已经在染色体上定位了与心脏病、2型糖尿病、精神分裂症、身高和眼睛颜色等复杂特征密切相关的位置。 GWAS是基于遗传连锁和遗传标记的原理。 GWAS不能直接鉴定与复杂性状相关的基因。相反,顾名思义,GWAS将未知基因可能所在的染色体位置联系起来。为此,GWAS利用了遗传学中的两个原理,即遗传连锁和遗传标记。遗传连锁是指不同的基因在同一条染色体从而一起遗传的现象(图7.3)。序列之间越接近,它们一起遗传的概率就越大。因此,如果我们能够找到一个已知基因的位置,该基因可能接近我们的未知基因,那么我们的搜索范围就缩小了。遗传标记提供了已知的DNA序列。遗传标记是精确定位到染色体上某个位置的DNA序列。在染色体上建立遗传标记需要构建基因图谱(图7.4)。基因图谱正在不断更新,并可用于所有23条(译者注:应该是24条,X和Y染色体不完全相同,需要单独构建)人类染色体。基因图谱存储在美国国立卫生研究院、学术机构和商业实体维护的公共和私人数据库中。
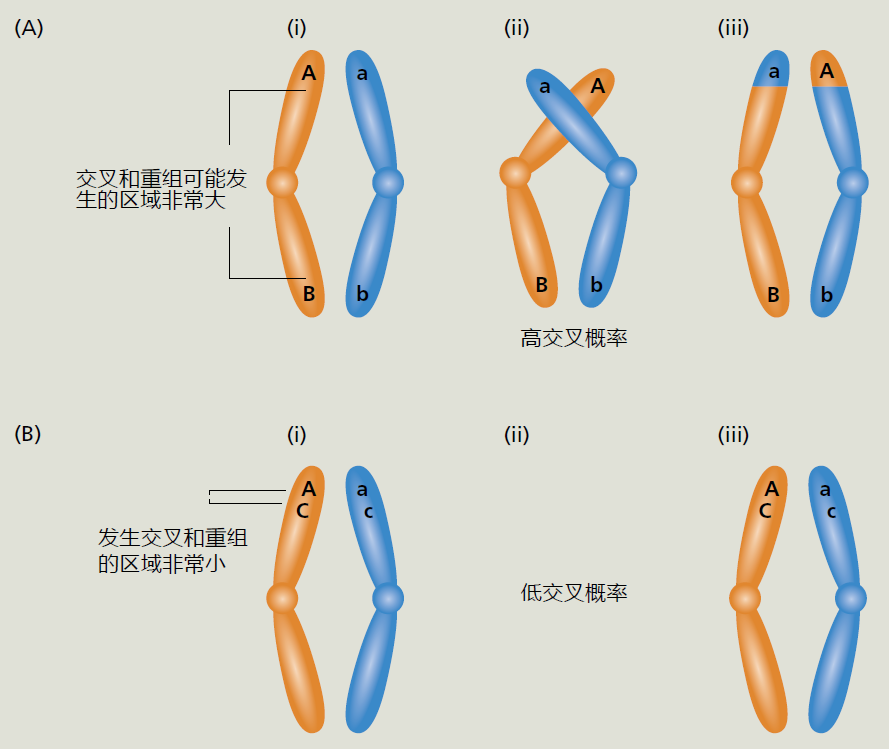
图7.3 交叉和遗传连锁。例如,我们有三个位于同一对同源染色体上的独特基因Aa、Bb和Cc(为了便于演示,我们只显示了每个染色体对的一个姐妹染色单体)。先来看图(A),我们看到基因Aa和Bb距离较远(i)。这个距离为联会(交叉互换)提供了足够的空间,也就是在减I后期过程中同源染色体之间的遗传物质交换。联会之后的结果代代相传,这种交叉将使这两个基因相距甚远,并允许同源重组。随着进化时间的推移,基因Aa和Bb可能会变得不相连,即它们一起遗传的概率很低。在图(B)中,我们看到Aa和Cc之间的距离非常小,导致交叉和同源重组(i和iii)的空间有限或没有空间。这两个基因紧密相连,这意味着它们极有可能代代相传(2C),也就是说,它们很有可能一起遗传。
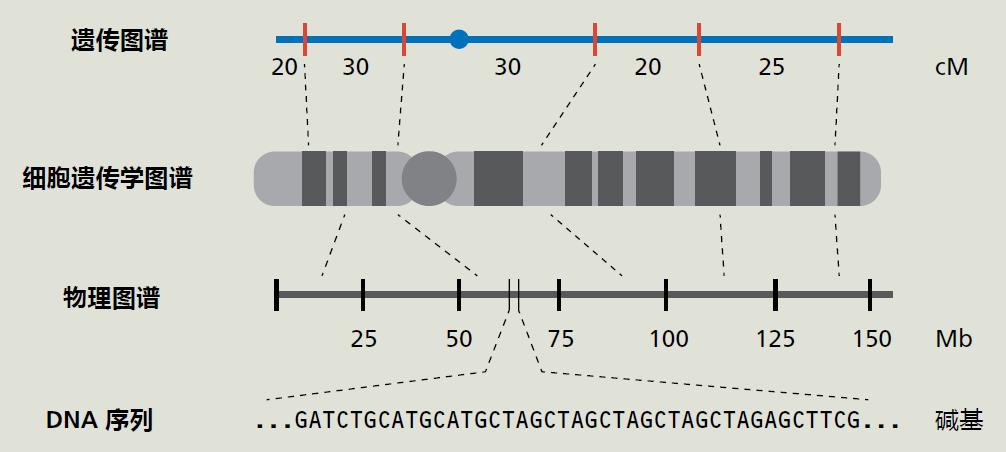
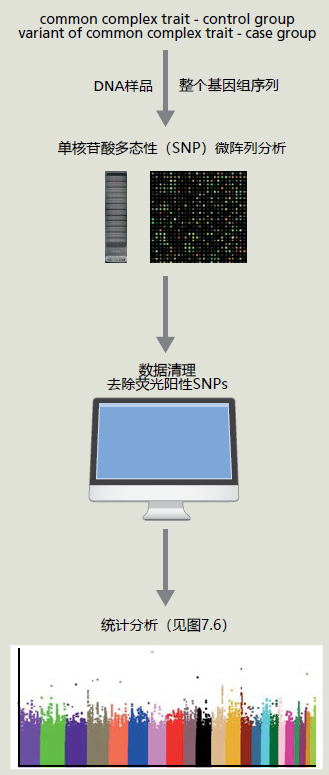
图7.4 基因图谱。在分子生物学和基因测序取得进展之前,DNA序列或基因是通过遗传图谱定位的,遗传图谱基于减数分裂过程中同源重组的概率。遗传图谱是以centi摩尔根(cM)为单位测量的,这是一个遗传距离单位,代表减数分裂过程中1%的重组概率。由于cM代表一种概率,遗传图谱只是对染色体位置的估计。细胞遗传学图谱的引入为科学家们提供了一种更精确地绘制染色体图谱的视觉方法。把染色体染色并在显微镜下检查时,染色体表现为亮带和暗带,这使每条染色体都有独特的外观。亮带和暗带的变化使科学家能够寻找染色体的改变。现代分子生物学技术让科学家可以计算染色体上碱基对的数量。将细胞遗传学图谱与物理图谱相结合,可以精确地定位染色体上的基因。基因图谱方法的最后一个也是最近添加的技术是DNA序列。科学家将利用该序列克隆该基因并确定其功能。(来自Wetterstrand KA.基因图谱[在公共领域]。可在:https://www.genome.gov/10000715/genetic-mapping-fact-sheet/.) GWAS使用单核苷酸多态性的方式进行遗传标记,简称为SNPs(发音为snips),这些DNA序列与“正常”人类序列中发现的预期序列仅相差一个碱基对。通过比较来自26个国家的2500多个不相关个体的全基因组DNA序列,数百万个SNP已被定位到23对染色体中的每一对染色体上的位置(见http://www.internationalgenome.org/)。通过同源重组,几个SNPs形成的区块被分离。也就是说,这些区块中的SNPs将一起被遗传。利用遗传连锁原理,SNPs可以识别染色体上可能与影响复杂性状的基因相关的区域。 GWAS比较单个复杂性状具有不同表达的个体组之间的SNPs。 我们现在拥有启动GWAS所需的遗传工具、遗传连锁和全基因组SNPs的位置。GWAS采用实验-对照设计(case-control design),因此这是一项有两组的对照性研究(retrospective study):一组表达罕见表型变异(实验组),另一组表达最常见表型(对照组)(图7.5)。表型的实验组版本必须足够罕见,从而使这种个体被纳入对照组的概率较低。例如,复杂的长寿特征可以分为两组,一组的个体年龄接近其种群的平均寿命,称为对照组,另一组的极长寿命,目前定义为百岁老人,称为实验组。百岁老人符合我们的实验组选择标准,因为他们很罕见,约占世界人口的0.006%(目前估计,全球70亿人口中的百岁老人人数为45万)。因此,即使GWAS评估寿命的过程中在对照组加入了一位百岁老人,那么最终结果也差别不大。我们在GWAS中的下一步是对两组中的所有个体进行全基因组测序,然后准备全基因组序列用于微阵列分析(第5章)。
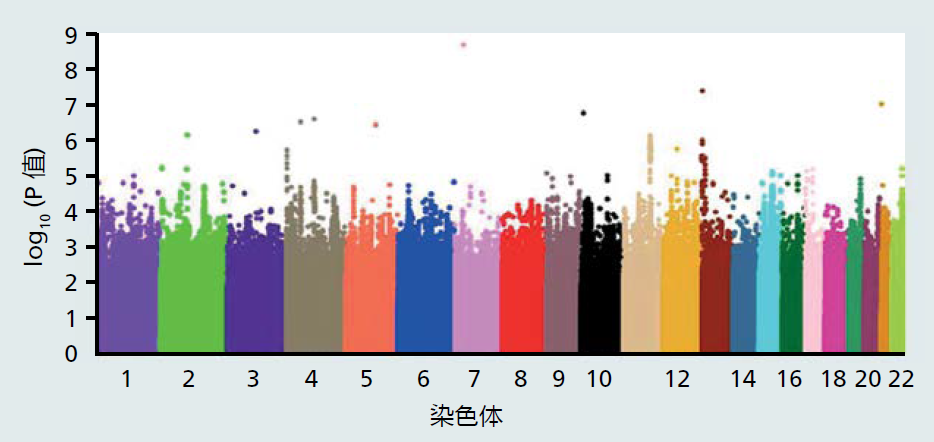
图7.5 用于GWAS的实验设计。 GWAS中使用的微阵列包含数百万个荧光标记的SNPs,这些SNPs已精确定位到染色体上的位置。当研究中取自个体的DNA序列与微阵列上的互补SNP序列结合时,摄像机会捕捉荧光并将数据存储在微阵列读取器的计算机中。然而,微阵列的荧光成像本质上仍然是“混乱的”,并可能导致许多假阳性,当SNP实际上是阴性时,这种信号表明与SNP呈正相关。因此,在开始统计分析之前,必须使用基因组技术完成扩展数据清理。 Once the data set has been cleaned, the fluorescent data for each individual's microarray are grouped together into their respective experimental groups, that is, case or control, and means ± standard errors for each SNP are calculated. The SNP means are then compared to determine if they differ significantly between the two groups. Differences in the group means are visualized by generating a Manhattan plot (Figure 7.6). The criteria set for accepting a difference between two means is extremely conservative for GWAS. The conservative criteria provide another mechanism that ensures our analysis does not accept false positives. Most non-GWAS investigations evaluating a difference between the group means set the significance criteria at p < .05, meaning that there exists a 95% chance that the groups differ on the selected variable (5% percent chance that they do not differ). GWASs require that the significance level be set at p < 1 × 10⁻⁵, a 99.5% chance that the means are different (0.5% chance that they do not differ). Once the difference has been determined for a SNP, the researcher can use gene maps to identify genes located near the SNP. In conclusion, GWAS and other similar methods reflect only the beginning of a new approach to human genetics. The GWAS is the first technique that allows researchers to evaluate the entire human genome for possible locations of genes associated with complex traits. Undoubtedly, the GWAS will be improved, and new, even more precise methods for locating genes associated with various complex traits, including longevity, will be developed. Combining these new techniques with systems biology (Chapter 1), the day will come when the critical genetic factors impacting the complex human trait of longevity are isolated. In turn, our new ability to manipulate genes (see discussion on CRISPR, Chapter 1) will provide scientists with the tools necessary to genetically increase life span. What this new frontier of growing old will mean to the individual and society is anybody's guess. We will explore, in the chapters ahead, a few of the challenges facing a society where living into the 10th and 11th decades of life will no longer be rare.
Figure 7.6 A Manhattan plot showing possible locations of genes associated with longevity. Each dot represents a p-value, a statistical value giving the probability that two means differ. These p-values correspond to possible differences in chromosomal location of SNPs among 2,178 Chinese centenarians (case group; mean age=102 years) and 2,299 middle-aged Chinese (control group; mean age = 48 years). Dots (SNPs) appearing above 5.5 on the y-axis met the criteria of significant differences, p<1×10⁻⁵(see text). Since each SNP has been mapped to its precise location on the chromosome, additional research can begin to identify possible genes in those locations that may contribute to longevity. For example, note the lavender dot located above chromosome 7 at a position close to 9 on the y-axis. The SNP name is rs2069837, a standardized coding number associated with one of the public databases. rs2069837 corresponds to a chromosome location of 7q15.3: where 7 corresponds to the chromosome; q corresponds to the long arm of the chromosome (a “p” would indicate the short arm); and 15.3 indicates the band number on a cytogenetic map (see Figure 7.4). Thus, the rs2069837 SNP is located on the long arm of chromosome 7 at band number 15.3. The principle of genetic linkage can now be used to locate genes with a high probability of being inherited with SNP rs2069837. (From Zeng Y et al. 2016. Sci Rep 6:21243; doi: 10.1038/srep21243.) |
Recall (Chapters 3 and 5) that evolutionary theory predicts, and studies in laboratory animals supporting that prediction suggest, that human longevity reflects the fixing of multiple genes imparting small effects—that is, a complex trait. Until the introduction of the GWAS, testing the evolutionary theory that human longevity is a complex trait was not possible (see Box 7.1). Using the GWAS, several studies have been completed evaluating possible gene/allelic differences between centenarians and the general population. These studies have either been unable to find genetic association or found only a handful of significant associations. The notable exception has been the consistent observation that allele variation in a gene participating in cholesterol metabolism, apoE, shows an association with longevity. The importance of apoE allele variants as a genetic predictor of common diseases of the aged is discussed in Chapter 9.
The limited association between allelic variants and the centenarian phenotype most likely reflects the rarity of variants associated with exceptional longevity. As explained in Box 7.1, the DNA sequence variants contained on current microarrays are those associated with common variants found in the general population. Centenarians are genetically different from the general population and are extremely rare, constituting less than 1 in 5,000 (0.0006%) within their birth cohort. Thus, one would expect variants associated with exceptional longevity to also be rare. These rare variants would not be contained on the microarrays used by a GWAS evaluating genome difference between centenarians and the general population.
Identification of rare gene variants among centenarians is moving away from GWAS and into a technique known as deep sequencing. Deep sequencing refers to the comparison of a single genomic region in thousands of organisms of one species or cells within a single organism to determine possible small and rare base-pair differences. This technique has been made possible by next-generation sequencing instruments (see Box 5.2), where one run of sequencing can compare hundreds of samples. Deep sequencing has found extensive use in cancer research where the genomes of tumor cells are compared to normal cells. Cancer therapies can then be developed precisely to match the tumor cells' genomic sequence—that is, precision medicine. The use of deep sequencing in gerontological research has only just begun, and results of such studies have not yet been published. Nonetheless, deep sequencing has great potential to find rare genomic variants in centenarians versus younger age groups.
Human intelligence altered mortality rates
Darwin's principle of reproductive fitness closely links fitness to a species' adaptation to environmental conditions. For the majority of species on Earth, adaptation occurs purely as a chance event, when an allele arises in an individual that increases the probability of its survival to reproductive age. That is, for most species, mortality rates reflect an adaptation to the environment (see Chapter 1). The origin of longevity in Homo sapiens may have resulted from our advanced intelligence, which has allowed us to adapt the environment to our genes and thus change mortality characteristics. For example, the use of tools, such as sharpened stones and bones, enhanced our ability to hunt and increased the variety of foods in our diet. Early H. sapiens would have had significantly better nutrition, which contributed to our larger size compared with other primates—a significant survival advantage. Invention of the needle and thread led to better clothing, which allowed us to inhabit geographical locations different from those in which our physiology had evolved. We were no longer dependent on the local environment to provide food; we could move to where the food was and thus gain a significant survival advantage.
The intelligence that allowed H. sapiens to manipulate the environment for a survival advantage would probably have had a significant impact on the survival of mothers and infants. The increase in the quality and quantity of food and nutrition, along with advances in simple technology (tools), would have reduced maternal deaths at birth—which, most likely, would have had two outcomes that decreased mortality rates and increased life span.
First, mothers surviving birth would live to have more children. Having more children increased the chance of at least one child, if not more, surviving to reproductive age. Surviving to reproductive age meant the individual had superior genes, better at fending off infections and other detrimental environmental conditions. Thus, what arose as a product of intelligence—reduced maternal deaths at birth—may have resulted in children with genes imparting lower mortality rates and greater life span. As you learned in Chapter 3, a subpopulation of longer-lived individuals could have arisen that also significantly influenced the longevity of our species.
Second, better nutrition and better protection from the elements would have allowed the investment of more resources in offspring and thus improved the infant mortality rate. As discussed in the next section, infant mortality rates have a great impact on life span. A decreased infant mortality rate might also have led to fewer births, allowing parents to concentrate their resources on fewer children and to improve the overall quality of their offspring.
Human intelligence produced a unique longevity trajectory
The uniquely human ability to manipulate the environment, due to our superior intelligence, has been fundamental in shaping the characteristics of human longevity. However, researchers cannot directly measure intelligence in our phylogenetic predecessors—one cannot give intelligence tests to fossils. Instead, biodemographers often turn to the indirect measures of intelligence used in physical anthropology and evolution/ecology to support their mathematical predictions on the origins of longevity in H. sapiens. To this end, brain size, measured directly in living animals or deduced from the sizes of the brain cavities of fossilized skulls, has been used to approximate intelligence.
The positive correlation between brain size, body weight, and longevity in mammalian species has been known for several decades (Figure 7.7) (see also Chapter 1). In general, the larger the body and brain weight, the longer is the life span. These early correlations also describe a distinctive phylogenetic separation between primates and nonprimates. Note in Figure 7.7 that the data points for primates and humans fall above the regression line, whereas the data points for rodents and ungulates fall below the regression line. This means that the body/brain weight–life span correlation in primates (human and nonhuman) is separate from that in other phylogenetic groups. Moreover, the body/brain weight–life span correlation in humans is significantly different from that in other primates, suggesting yet another phylogenetic separation for intelligence among primates. For these reasons, biodemographers generally limit their analysis of the origins of human longevity to the primate order.
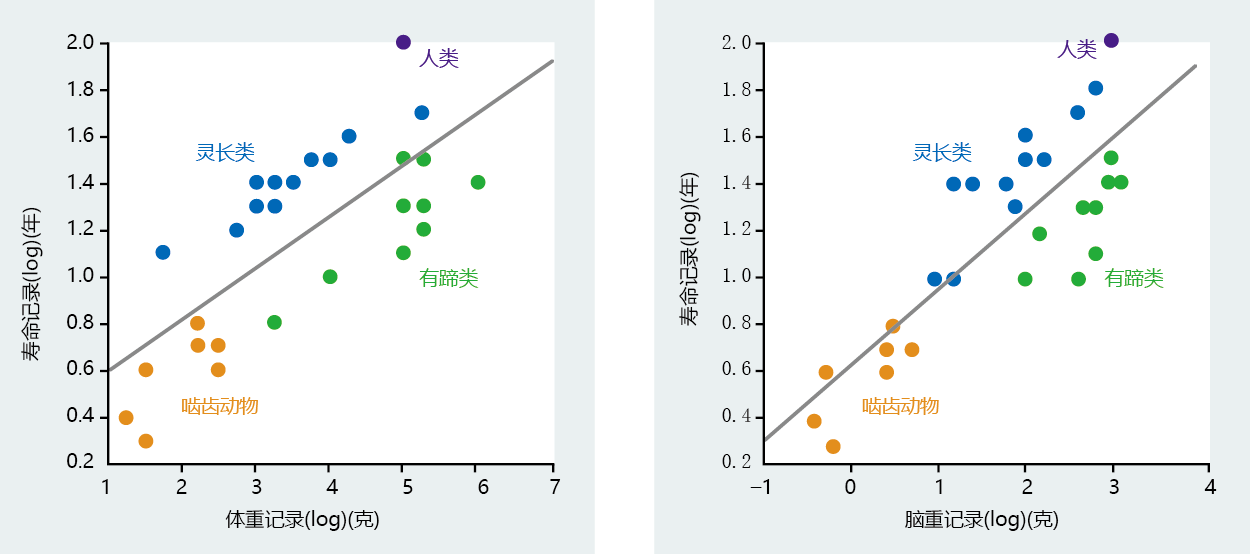
Figure 7.7 Correlation of body weight and brain weight with life span in various mammalian groups. Note that the human life span is considerably greater than that of ungulates (hoofed animals, in several orders of mammals) of similar body weight. A significantly larger brain underlies the difference in life span between humans and the other three groups of mammals. (From Sacher GA. 1959. In Lifespan of Animals [GEW Wolstenholme, M O'Connor eds.], pp. 115–141. London: J.A. Churchill. Little Brown and Co. With permission from Elsevier.)
New World and Old World monkeys have significantly smaller brains and shorter life spans than humans (Figure 7.8). Moreover, the great apes with body weights similar to those of humans have smaller brains and a shorter life span. If we narrow the analysis even further by considering only hominids, the strong relation between brain size and life span remains (Figure 7.9). There is also a tremendous shift in life span between our immediate phylogenetic relatives and modern humans. The life-span difference between Australopithecus afarensis and Homo erectus is approximately 15 years, with a change in brain weight of 450 grams taking place over 3 million years. H. sapiens developed a brain weight almost 400 grams greater than that of H. erectus in less than 700,000 years, which translated into a gain in life span of 60–70 years. Thus, the anthropological data indicate that intelligence, as measured by cranial volume, set H. sapiens on a mortality and life-span trajectory distinctly different from that of our immediate phylogenetic predecessors.
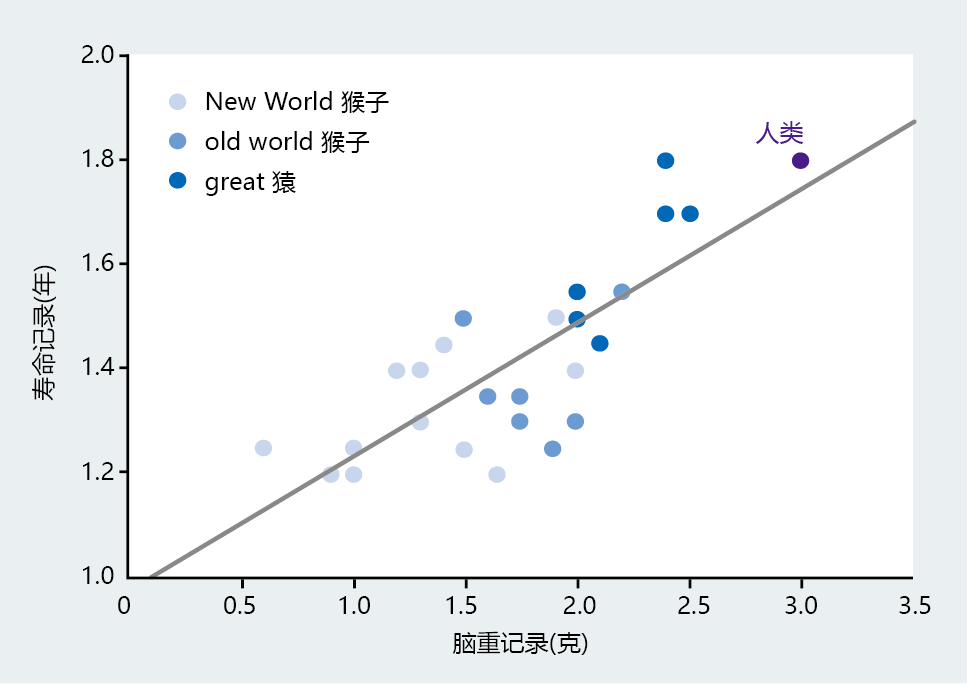
Figure 7.8 Correlation between brain weight and life span in humans and their immediate phylogenetic relatives. These data indicate that brain weight, even among morphologically similar species, has been a critical factor in the origins of human longevity. (From Carey JR. 2003. Longevity: The Biology and Demography of Lifespan. Princeton, NJ: Princeton University Press. With permission from Princeton University Press.)
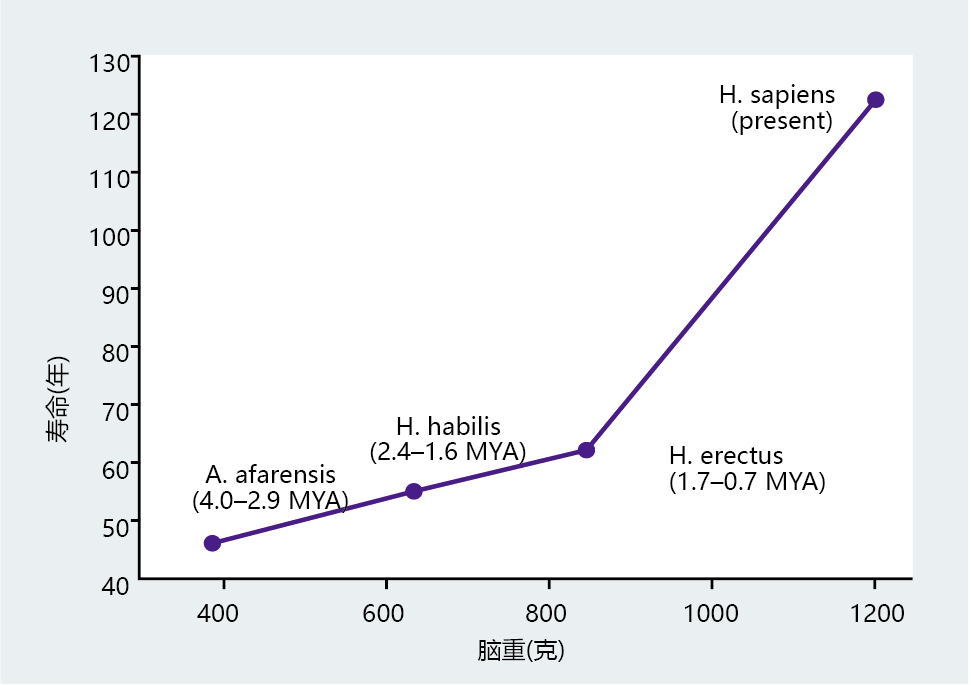
Figure 7.9 Correlation between brain weight and life span in humans and earlier hominids. Life spans of Australopithecus afarensis, Homo habilis, and Homo erectus were estimated from fossils on the basis of dental and bone development. Brain weights in these hominids were estimated from brain-cavity volume. MYA = million years ago. (From McHenry HM. 1994. J Hum Evol 27:77–87. With permission from Elsevier.)
Heredity has only a minor influence on human life span
We have stressed that intelligence allowed early Homo species to manipulate their environment, thus increasing survival and establishing conditions that could have resulted in a genetic drift toward greater longevity. In other words, human longevity seems to have followed the prediction of the evolutionary theories proposed by Medawar and Hamilton that you learned about in Chapter 3. Recall that the term life span applies to individuals within a species rather than to the species itself and is determined largely by an individual's rate of aging. That is, an individual's life span is determined by random events occurring over time. So, if the evolutionary theories are valid, we would expect heredity to have a minor effect on life span.
We can test this possibility by evaluating the correlation between the age of death in parents and their children and in twins. Weak correlations would suggest that the nongenetic components of life span are more influential than genetic factors in H. sapiens.
Results for investigations, dating back to 1903, that compare age of death in a parent with age of death in offspring have consistently shown very weak correlations. That is, contrary to popular belief, our life span is not determined by our parents. TABLE 7.1 shows the contribution of heredity to life span in a French Canadian population born during the nineteenth century. Although the contribution varies with age of death of the offspring and with gender, heredity accounts for no more than about 10%–16% of the total influence on life span. Similar results have been found when evaluating the age of death in monozygotic (identical) and dizygotic (fraternal) twins: the contribution of heredity to life span was found to be no more than 25% in 2,800 Danish twin-pairs. Together, comparisons of the age of death of parents and their offspring and of twins strongly suggest that nongenetic factors influenced by intelligence may have had a significant effect on life span in H. sapiens. The nature of these nongenetic factors is discussed in the next section.


