8.1 CHANGES IN BODY COMPOSITION AND ENERGY METABOLISM
The shape and composition of the human body reflect, for the most part, the relationship among the amounts of its four primary constituents: water, protein, lipid, and bone. Although lifestyle and personal choices can have a major impact on body composition, the amounts of protein, lipid, and bone are also influenced by the physiological stage of life (the percentage of water in the body remains remarkably consistent throughout life).
From infancy through puberty, the body focuses on the growth and development of its internal organs, bones, and cells of the immune system, and the rate and amount of protein deposition are higher during this period than at any other time in the life span. Prior to puberty, the shape and composition of the human body do not differ significantly between the sexes, but the onset of puberty initiates a greater focus on the growth of sex-linked characteristics. Muscle development in males outpaces that in females, while females generate greater fat deposition. Both sexes experience significant growth in bone mass, proportional to their final body height. The shape and composition of the human body during growth and development have a strong genetic component, but as the current epidemic of childhood obesity demonstrates, environmental influences are also important.
Once growth and development have ended—somewhere between 25 and 30 years of age—the size, shape, and weight of the human body reflect, for the most part, factors over which we have direct control. While the normal, active, and developmentally mature adult experiences a slight time-dependent decrease in the mass of muscle, internal organs, and bone, fat stores remain dynamic throughout life, increasing or decreasing depending on nutrition and exercise. Near the end of the life span, decreases in all components of the body accelerate.
In this section, we examine the common time-dependent changes in the composition and size of the human body, along with the mechanisms that underlie these changes. We begin with a brief summary of how energy intake and expenditure affect the amount of fat we store. Then we look more closely at specific time-dependent alterations in body composition and weight.
Energy balance is difference between intake and expenditure
Humans, like all organisms, need energy to drive the basic chemical reactions of life. Our energy comes from the food we eat in the form of fat and carbohydrate. (Humans do not, to any great degree, use protein as an energy source, except during starvation.) The biochemical mechanisms by which fat and carbohydrate give rise to ATP, the cellular form of energy, were detailed in Chapter 4. Here we look at ways to evaluate whether the combination of food intake (energy intake) and physical activity (energy expenditure) leads to maintaining, losing, or gaining weight. We begin by calculating energy balance, using Equation 8.1:
Energy balance = Energy intake - Energy expenditure (8.1)
Our energy intake is easily determined by calculating the amount of energy in the fats, proteins, and carbohydrates of the food we eat. This energy is measured in joules. A joule (J) is defined as the energy expended in applying a force of 1 newton through a distance of 1 meter. Because scientists are concerned with large amounts of energy, food energy is generally expressed in kilojoules (kJ): 1 kJ = 103J. You might also see food energy expressed in kilocalories (kcal), an older convention that is still often used. A calorie is the amount of energy required to heat 1 gram of water 1°C (1 kcal = 103cal). The conversion factors for kilojoules and kilocalories are 1 kJ = 0.239 kcal, and 1 kcal = 4.184 kJ. TABLE 8.1 shows the energy content of the four macronutrients in food types: fat, protein, carbohydrate, and alcohol. By summing the total amount of energy of the macronutrients in food we consume in a day, we can determine our energy intake for the day. Although protein and alcohol are not generally used as starting substrates for producing ATP, they do have the potential to be converted to fat and carbohydrate and stored in the body's energy reserves; thus, they must be included in the calculation of energy balance.
 Determining energy expenditure is a bit more complicated and is normally accomplished through indirect calorimetry, a calculation of energy expenditure based on the measurement of respiratory gases (Figure 8.1). Total energy expenditure (TEE) includes three components: resting energy expenditure, physical activity, and diet-induced thermogenesis (Equation 8.2). TEE is also measured in kilojoules or kilocalories.
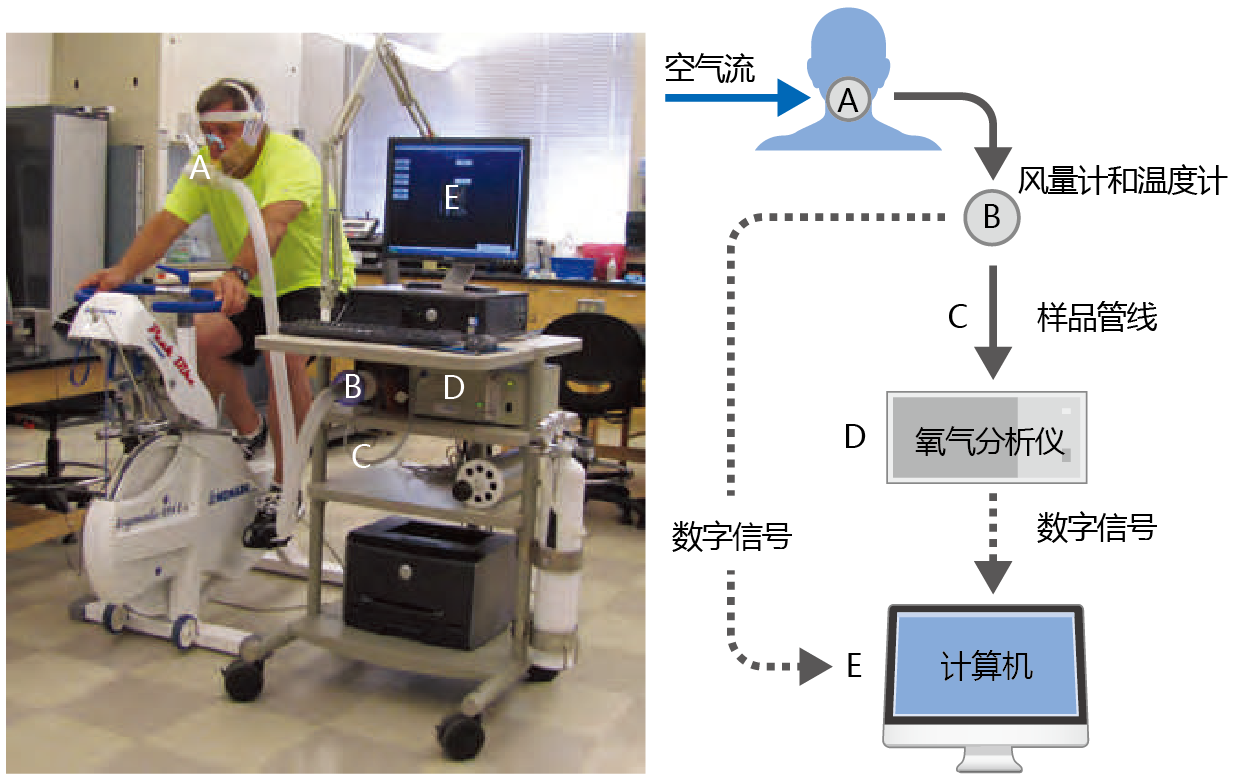
Figure 8.1 Indirect calorimetry. Oxygen consumption by the whole body can be determined through an analysis of respiratory gases. (A) The subject breathes through a one-way valve, which forces air to move in one direction (solid arrows). (B) The expired air travels through a hose to a device that measures its volume and temperature. (C) A sample of the expired air goes to the oxygen analyzer (D); the most common type of oxygen analyzer heats the air to a temperature that causes ionization of the oxygen molecules. (E) An ionized-oxygen detector inside the analyzer sends a digital signal (dotted lines) with information on the raw oxygen amount to a computer. The computer calculates the actual oxygen amount by adjusting the raw amount based on the temperature of the expired air. Subtracting the amount of expired oxygen from the amount of inspired oxygen gives the oxygen consumption. Multiplying the oxygen consumption (in liters) by 20.92 kJ gives a good estimate of energy expenditure. (Photo courtesy of Jennifer Ruhe.)
Total energy expenditure (TEE) = Resting energy expenditure (REE) + Physical activity + Diet - Induced thermogenesis (DIT) (8.2)
Resting energy expenditure (REE) is the amount of energy required to maintain the essential functions of life—heart rate, body temperature, brain function, and so on—and makes up 60%–70% of TEE. Physical activity includes all movement of skeletal muscles, no matter how slight, and, on average, contributes about 20% to TEE in the adult human. However, the contribution of physical activity to TEE varies significantly among individuals. For example, a highly trained endurance athlete may expend as much as 30% of his or her TEE on exercise, whereas a truly sedentary individual may expend only 5% of TEE on physical activity. Diet-induced thermogenesis (DIT) is the amount of energy required for digestion, absorption, and nutrient storage and accounts for the remaining 10%–20% of TEE. The contribution of DIT to TEE does not vary much among individuals or with age, is difficult to measure, and is normally included as a constant in the TEE equation.
Accumulation of fat occurs throughout maturity
The typical mature human body contains almost 40 days' worth of energy in the form of fat, whereas we store only about 1 days' worth of energy in the form of glucose. Thus, when we measure the energy state of the mature human body—the energy balance—we are actually measuring the dynamics of fat storage. Positive energy balance—greater energy intake than expenditure—results in an increase in fat storage and in body weight. Negative energy balance—greater expenditure than energy intake—results in decreased fat storage and body weight. A person is said to be in energy balance when intake and expenditure are equal. In this case, body weight does not change.
Once we have attained full growth and development—that is, maturity—changes in our body weight reflect alterations in the amount of fat we store. Data collected from the ongoing National Health and Nutrition Examination Survey show that body weight increases, on average, by approximately 5% and 9% in women and men, respectively, between the ages of 20 and 60–69 (Figure 8.2). The increase in weight occurs slowly, as small changes in energy balance over long periods have large effects on body weight. We can use a simple example to demonstrate the impact of small changes in energy balance sustained over long periods on the storage of fat. Consider a woman weighing 50 kg (about 100 pounds) with 10 kg of stored fat, equivalent to 389,000 kJ of energy (38.9 kJ/g × 10,000 g; see Table 8.1). This woman is currently in energy balance, with a daily food intake of 8370 kJ and a constant and stable REE and DIT of 5857 kJ and 837 kJ, respectively. Using Equation 8.2, we can calculate the amount of energy she uses per day in physical activity (Equation 8.3):
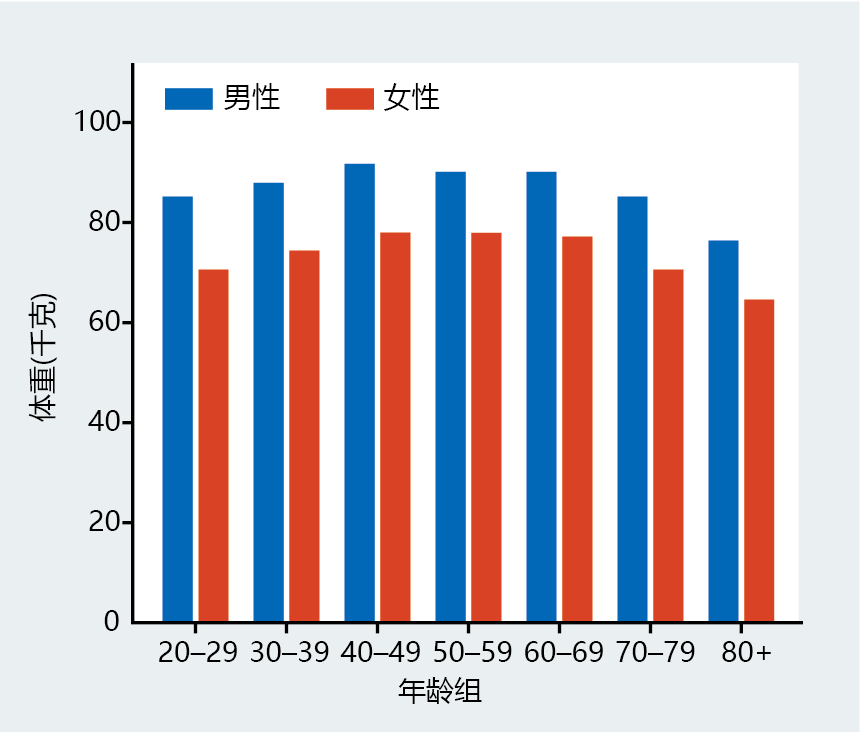
Figure 8.2 Average weights of men and women in the United States in 2010. These data are from the most recent year using a large population (20,000 participants) and include individuals over the age of 70. (From Fryar CD, Gu Q, Ogden CL. 2012. Anthropometric reference data for children and adults: United States, 2007–2010. National Center for Health Statistics. Vital Health Stat 11[252].)
Totalenergy expenditure (TEE) = 8370kJ
Resting energy expenditure(REE) = 5857kJ
Diet-induced thermogenesis(DIT) = 837kJ
Thus,
Physical activity = TEE - REE - DIT
= 8370kJ - 5857kJ - 837kJ = 1676kJ (8.3)
If the woman begins to eat a little more each day, say just 418 kJ (equal to about 1/4 cup or 3 tablespoons of vanilla ice cream) while keeping her physical activity the same, her energy balance becomes positive and she begins to store fat. Thus, in approximately 100 days she will gain about 1 kg of body weight, and in 1 year she will gain almost 4 kg (1 kg of body fat is equivalent to about 38,900 kJ). Thus, even small changes in energy intake can have a significant impact on body weight over the long haul. Similarly, slight changes in energy expenditure would have the opposite effect. An increase in physical activity of 418 kJ daily, such as jogging at a moderate pace for 1 mile (or walking 1.5 miles), would bring the woman back into energy balance and prevent fat accumulation.
As indicated by this example, fat accumulation can result from excessive calorie intake, decreased physical activity, or a combination of the two. Changes occur to both calorie intake and physical activity over time. (BOX 8.1 describes a useful way of considering changes in body fat with age.). Calorie consumption tends to decrease with advanced age, although the absolute amount of calories has been increasing (Figure 8.5). Older individuals are also less likely than are younger people to meet the guidelines for leisure time activity (Figure 8.6). The lack of physical activity can lead to a loss of muscle tissue exceeding that expected for normal time-dependent skeletal muscle loss (a condition known as sarcopenia, discussed later in the chapter). The loss of muscle mass due to physical inactivity leads to a decrease in REE, exacerbating the time-dependent decrease in energy expenditure. The increase in calorie consumption and decrease in leisure time activity have resulted in an obesity epidemic among the older population. The average body weight of individuals over the age of 65 has risen more than 20% in the last four decades. Many surveys suggest that 50%–70% of the population over the age of 65 are either overweight or obese. The health consequences associated with overweight and obesity are discussed in Chapters 9 and 10.
|
BOX 8.1 BODY MASS INDEX AND MORTALITY RISK |
|
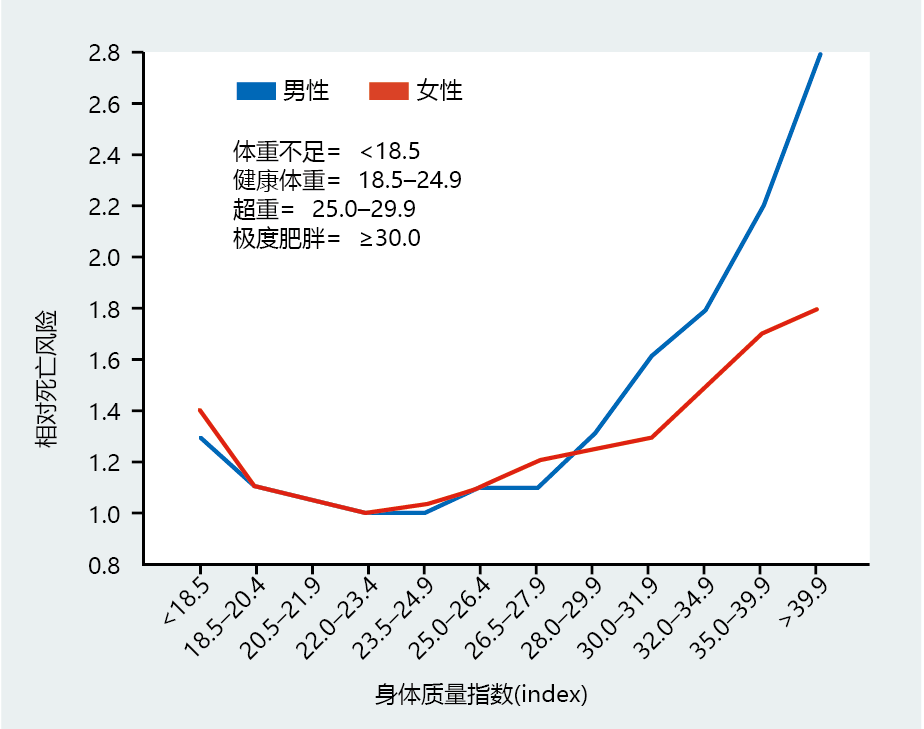
he body mass index (BMI), the ratio between weight and height (Equation 8.4), can be another useful way to describe changes in fat content. Since genetics plays a large role in determining one's final stature, and height generally remains stable when growth and development are complete, BMI is a more sensitive and individualized measure of body fat than just weight alone. More importantly, BMI has been shown to be highly correlated with mortality due to health problems associated with being underweight, overweight, or obese (Figure 8.3). Figure 8.3 Relationship between body mass index (BMI) and relative risk of death. These graphs, based on data from 457,758 men and 588,369 women, collected between 1984 and 1996, clearly show that the risk of death is greater for those who are underweight or overweight. The BMI categories (listed above the curves) are commonly used as age-independent markers for possible health problems associated with fat content in otherwise healthy adults over the age of 20. (Adapted from Calle EE et al. 1999. N Engl J Med 341:1097–1105. With permission from New England Journal of Medicine.)
BMI= weight (kg) / height2(m2 ) (8.4)
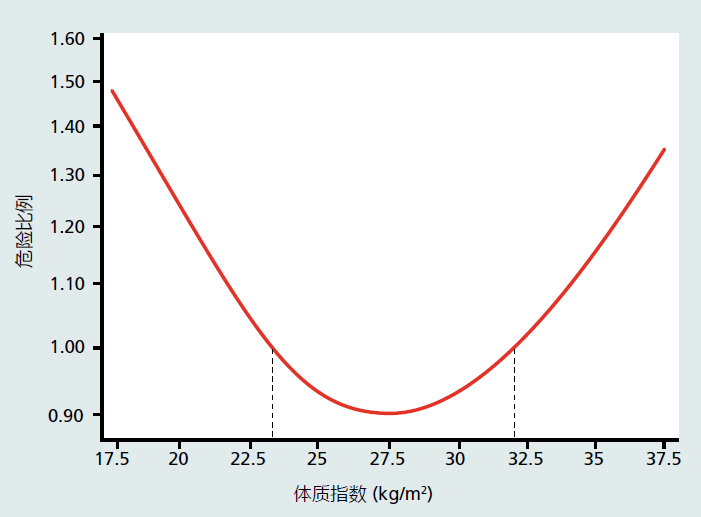
The calculation of BMI dates back to the early 1800s, when a Belgian social scientist, Adolphe Quetelet (1796–1874), found that body weight during growth varied as a function of height squared. The index, then called the Quetelet index, had limited use as a measurement relating obesity to health, primarily because obesity was virtually unknown in the general population at that time. It was not until the end of World War II that statisticians working for life insurance companies noted a slight increase in mortality rates among individuals weighing more than the average body weight for the population. This led to the development of the weight-to-height tables and the concept of an ideal body weight for a specific height. It was soon found that the large variation among individuals in what constituted an ideal body weight rendered the weight-to-height tables too inaccurate for use by physicians as a measure of health. In 1972, Ancel Keys (1904–2004) was the first to note that the Quetelet index was the best proxy for body fat and suggested its use as an easy method for physicians to discuss possible health problems associated with obesity. Keys popularized the term “body mass index.” The results of several investigations conducted during the last two decades of the twentieth century showed a close relationship between BMI and the risk for health problems. These findings led the National Institutes of Health (NIH) to establish specific BMI values as guidelines for healthy weight (shown in Figure 8.3). It has become clear that the NIH's BMI values need to be adjusted for the older population. Several longitudinal studies have found that BMIs in the range of 23–30 (a range considered overweight and with higher risk for health problems, according to NIH guidelines) do not increase health risk for those over the age of 65 (Figure 8.4). However, BMIs of less than 21–22 (considered underweight) remain a risk factor for health problems in the elderly. Most clinical experts agree that in the older population, being underweight poses a greater risk for health problems than being obese. Many clinicians have stated that individuals older than 65 who are within the 25–32 BMI range should not consider a weight-reduction plan, except for vanity reasons, and should not drop below a BMI of 22.
Figure 8.4 Relationship between BMI and all-cause mortality in individuals over the age of 65 years. A hazard ratio, values on the y-axis, represent instantaneous risk at the time the data were collected (2014). Hazard ratios greater than one indicate an increased risk of mortality; less than one indicates a decreased risk of mortality. The greater the hazard ratio, the greater is the risk. The areas within the vertical lines rising off the x-axis are BMI values associated with a decreased risk of death. The range of healthy BMI values seen here, 22.5–33.0, are considerably higher than those established by the NIH in younger populations (18.5–24.9, Figure 8.4). (Adapted from Winter JE et al. 2014. Am J Clin Nutr 99[4]:875–890.) |
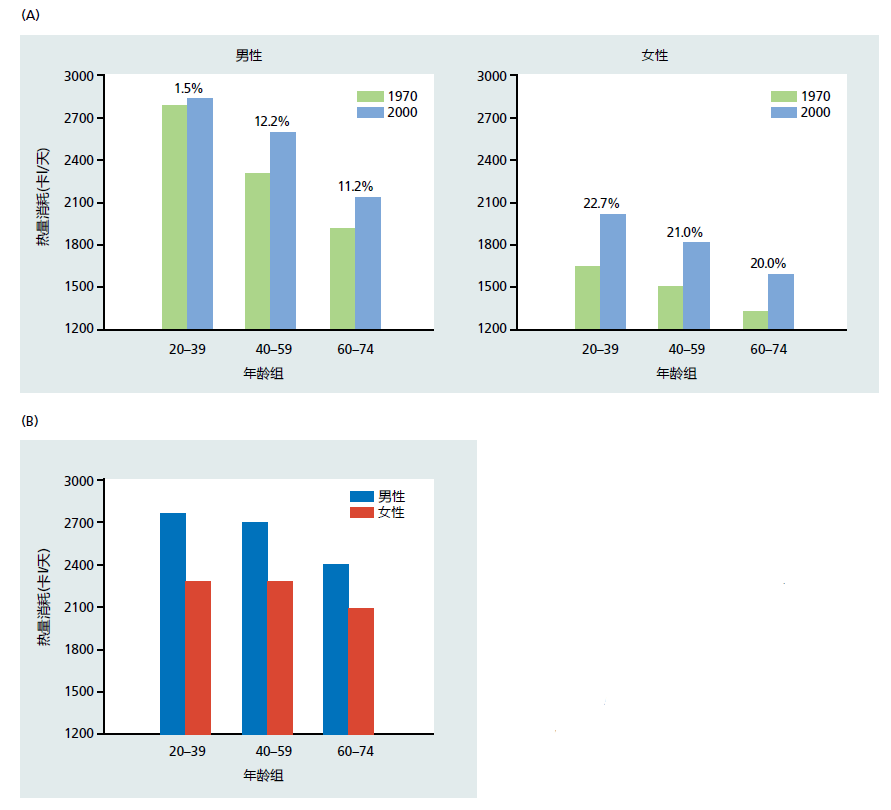
Figure 8.5 Average calorie consumption in adult men and women. (A) Calorie consumption between the years 1970 and 2000. Numbers above the bars are the percentage increase between 1970 and 2000. (B) Calorie consumption for the year 2008. Comparison of values in the two graphs indicates that calorie consumption has remained stable at the 2000 levels. Values presented here should be used only as a reference for trends and not as exact values. Determining accurately calorie consumption in large populations is extremely difficult. (Data from A, Wright JD et al. 2004. Mortal Morbid Wkly Rep 53:80–82; B, Wright JD et al. 2011. Mortal Morbid Wkly Rep 60:280.)
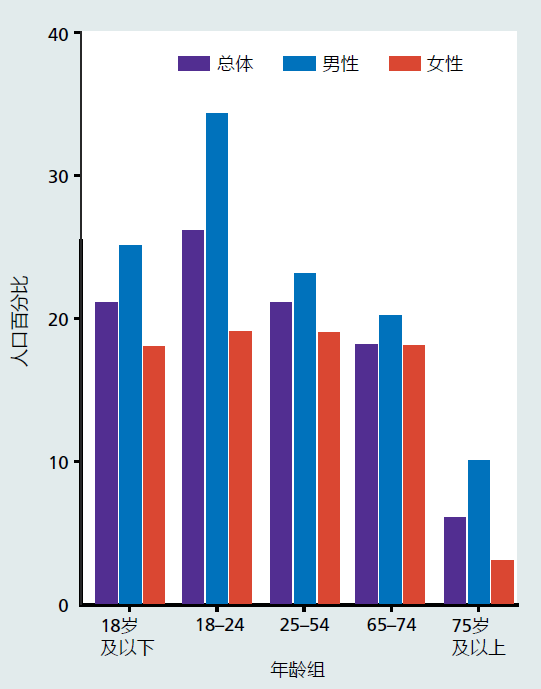
Figure 8.6 Percentage of adults aged 18 and over who met the 2008 federal physical activity guidelines (see https://health.gov/paguidelines/) in 2015. (Adapted from CDC/NCHS, National Health Interview Survey, 1997–March 2015, Sample Adult Core component.)
Excessive loss of body weight near end of life span associated with mortality rate
Although body weight increases throughout much of the human life span, there comes a time when weight begins to decline. This can be seen in Figure 8.5, where the body weight of those 70 and older is less than that in the younger age groups. The decreased body weight in this age group reflects the inclusion in the data of individuals near the end of their life span. End-of-life weight loss is accepted as a time-dependent phenomenon, and the underlying mechanism has not yet been identified. We do know, however, that both fat and muscle mass seem to decline during this period.
Recent data suggest that a decrease in food intake parallels the end-of-life decline in body weight and can lead to a clinical condition known as the anorexia of aging. The four hallmarks of the anorexia of aging—excessive weight loss, decreased appetite, poor nutrition, and inactivity—are the primary predictive symptoms of a larger and more general syndrome known as geriatric failure to thrive. This multifactorial syndrome, often indicating the end of life, includes impaired physical function, malnutrition, depression, and cognitive impairment. An algorithm for diagnosing geriatric failure to thrive has been established and suggests when physicians might begin discussing end-of-life options with patients and families. This discussion may prevent needless interventions that may only prolong suffering (Figure 8.7).
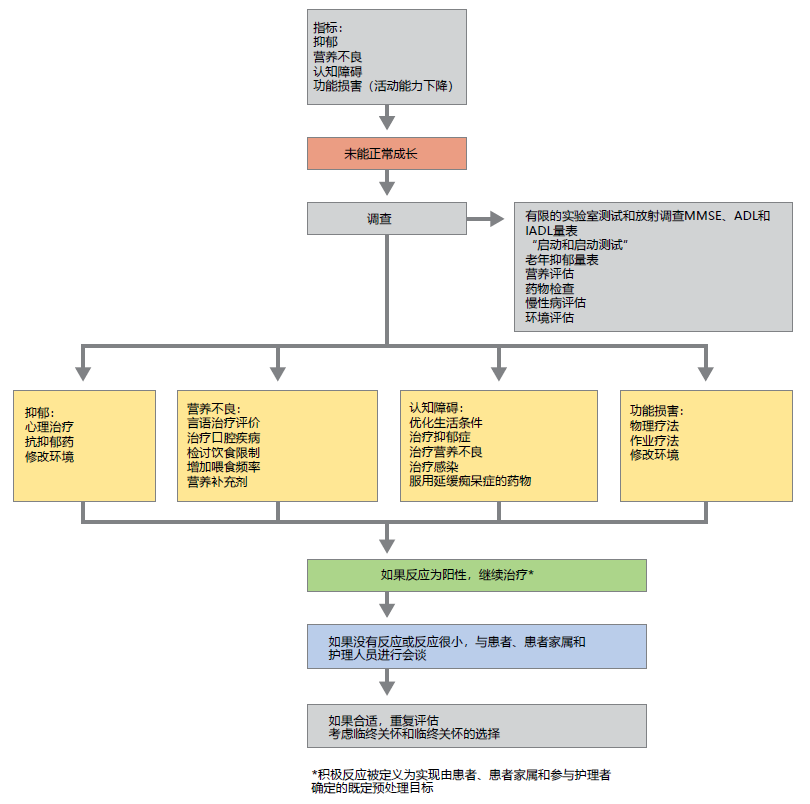
Figure 8.7 Algorithm used by physicians to diagnose and treat patients with geriatric failure to thrive. ADL = activities of daily living; IADL = instrumental activities of daily living; MMSE = Mini-Mental State Examination. (From Robertson RG, Montagnini M. 2004. Am Fam Physician 70:343–350. With permission from American Academy of Family Physicians.)


