2.1 在个体中测量生物学衰老
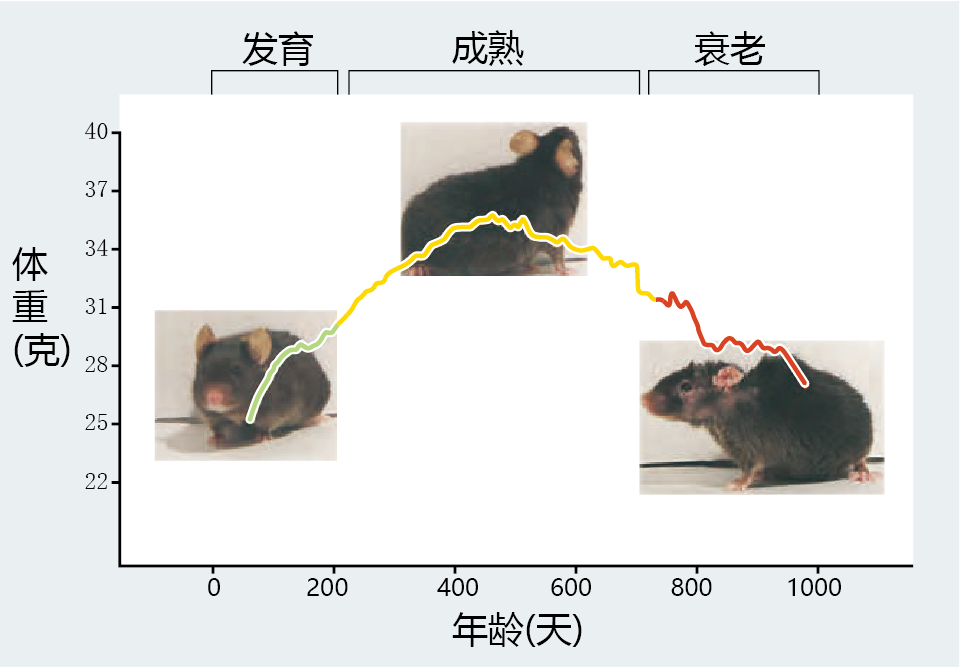
Describing changes in a cell or organism as a function of seconds, hours, days, or years is easy. Simply measure something (a variable), wait the appropriate amount of time, and measure it again. Any change in the variable is then expressed as a difference over time. The hard part arises in trying to determine whether time-related differences observed at the chosen points in time have any meaning for biological aging. For example, we observe that a mouse reaches sexual maturity at about 2–3 months of age and remains reproductively active for the next 12–15 months. When mice reach the end of their reproductive life, only slight declines in physiological functions occur over the next 4–6 months. Then, between 22 and 28 months of age, most mice experience 1–2 months of senescence before death. These time-related markers give biogerontologists a general idea of the mouse‘s life history and convenient points for comparison in research (Figure 2.1) .
Figure 2.1 Body weight provides a convenient marker for expected physiological functions in the mouse. The rapid rate of body weight gain between 50 and 100 days of age reflects the growth of tissues through cell division and the development of optimal physiological function. The slower rate of weight gain between 200 and 500 days of age results from an increase in fat deposits; physiological functions stabilize or show only slight decrements. From approximately 600 days of age to the end of the life span, the animal‘s body weight declines, as does physiological function. Note, however, the variable pattern in weight loss of the older animals—that is, large peaks and valleys—compared with the steady weight gain during development and maturity. This variability occurs because some animals are entering senescence while others remain in the maturity phase.
As valuable as these markers may be, many questions are left unanswered. For example, do the lengths of the development and maturity stages or the total length of life tell us anything about the physiological function of the mouse when half its life is over? Do all mice live 22–28 months, or is there some variation in length of life? If sexual development were to occur over 4 months instead of 3 months, would the mouse live longer? In this chapter, we examine similar questions and describe how biogerontologists measure the rate of biological aging, both in individuals and in populations.
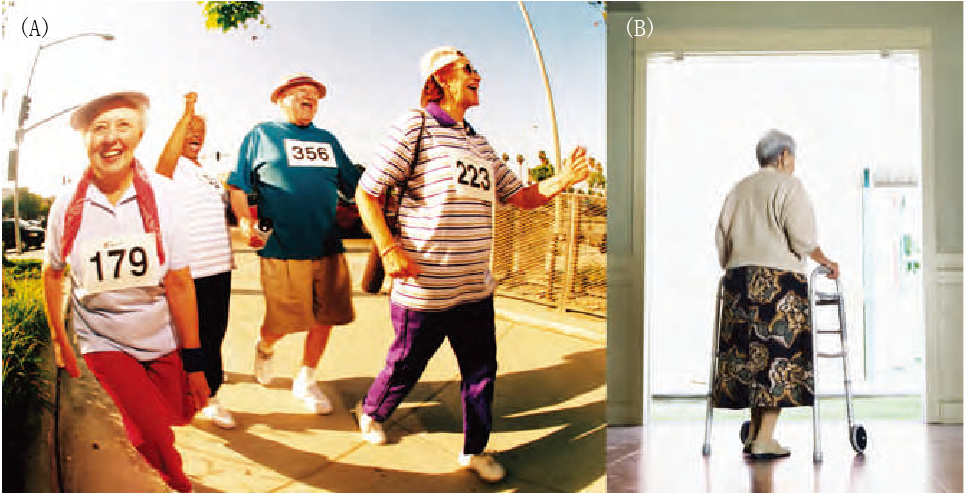
Most of us can think of examples of someone who, at 80 years of age, is running marathons, while another individual, at 70 years of age, is confined to a long-term care facility (Figure 2.2) . These examples demonstrate that the rate of biological aging is highly individualized and cannot be measured simply by consulting a calendar. What falls apart in one person may not be affected by aging in another. This means that population averages describing age-related changes can be very interesting as a general overview but may not have any specific relevance to us as individuals. We all want to know exactly what will happen to us as we grow old, rather than what may happen to the “average” person. If we knew which physiological system was likely to decline over time, we could take steps to prevent or treat that age-related dysfunction. This is why measuring the rate of aging precisely in each individual is the ultimate goal of biogerontological research.
Figure 2.2 Which of these people, of similar age, represent the rate of aging for humans? (A, courtesy of K. Chernus/Getty Images; B, courtesy of S. Hix/Somos Images/Corbis.)
Measuring the rate of aging in an individual requires that we identify a biological event that changes at a known rate over time. According to the American Federation for Aging Research, the following criteria must be met for a useful and accurate age-related biological marker, or biomarker, of aging:
- It must predict the rate of aging. In other words, the marker
should reveal exactly where a person is within his or her total life span. It must be a better predictor of aging than chronological age.
- It must monitor a basic process that underlies the aging process, not the effects of disease.
- It must be something that can be tested repeatedly without harming the person; for example, a blood test or an imaging test.
- It must be a process that works both in humans and in laboratory animals, such as mice, so that it can be tested in lab animals before being validated in humans.
In this section, we explore issues dealing with the measurement of aging at the individual level and the identification of a biomarker for aging. We begin by discussing how our interaction with the 环境 and our lifestyle choices make measuring aging at the individual level so challenging. Then we look at past attempts to identify biomarkers and discuss why these methods have not produced reliable indicators of biological age. Finally, we discuss new directions in biomarker research that may have great potential for providing a mechanism by which we can reliably measure the rate of aging in each individual.
2.1.1 Differences in the age-related phenotype affect the measurement of aging in individuals
We are born with a genetic pattern that results in physical attributes specific to our species. We have hands and fingers; birds have wings and claws. The genetic constitution of an organism is known as the genotype. As shown throughout this text, the rate of aging caused by the genotype, known as the intrinsic rate of aging, can be measured with a fair amount of accuracy. During fetal development and throughout the life span, the genotype interacts with the 环境 to produce
the phenotype. Biogerontologists refer to the impact of the environment on the genotype in producing the age-related phenotype as the extrinsic rate of aging. No two humans (genotypes) are ever exposed to identical 环境s for the same length of time so as to produce identical phenotypes; the age-related phenotype and the extrinsic rate of aging are infinitely diverse. As a result, measuring the impact of the extrinsic rate of aging on individual aging can be very difficult.
How the 环境 affects the genotype to produce the phenotype varies with age. From fetal development to about 3 years of age, our immune system, thermoregulatory ability, and brain are still developing. During this time, we are rather defenseless against the 环境 and must rely on the judgment and care of others, such as our parents, to survive. Geneticists have long known that the 环境 has the greatest impact on shaping our phenotype during this period. Human fetal development can be divided into two periods: one that is influenced primarily by the genotype, and one in which the phenotype begins to form. The first 8 weeks of fetal development are devoted exclusively to forming the basic tissues, organs, and anthropometric
characteristics that distinguish us as a species—that is, to expressing the genotype. Alteration to the in utero 环境 during this phase can result in the death of the fetus or genetic abnormalities at birth. The period from 9 weeks of gestation until after birth is a time of tremendous growth, characterized by rapid and sustained cell division. The rate of cell division and growth depends on many nongenetic factors, such as nutrition, oxygen supply, and removal of metabolic waste products. It is at this stage that the unique person each human will become—that is, the phenotype—takes shape.
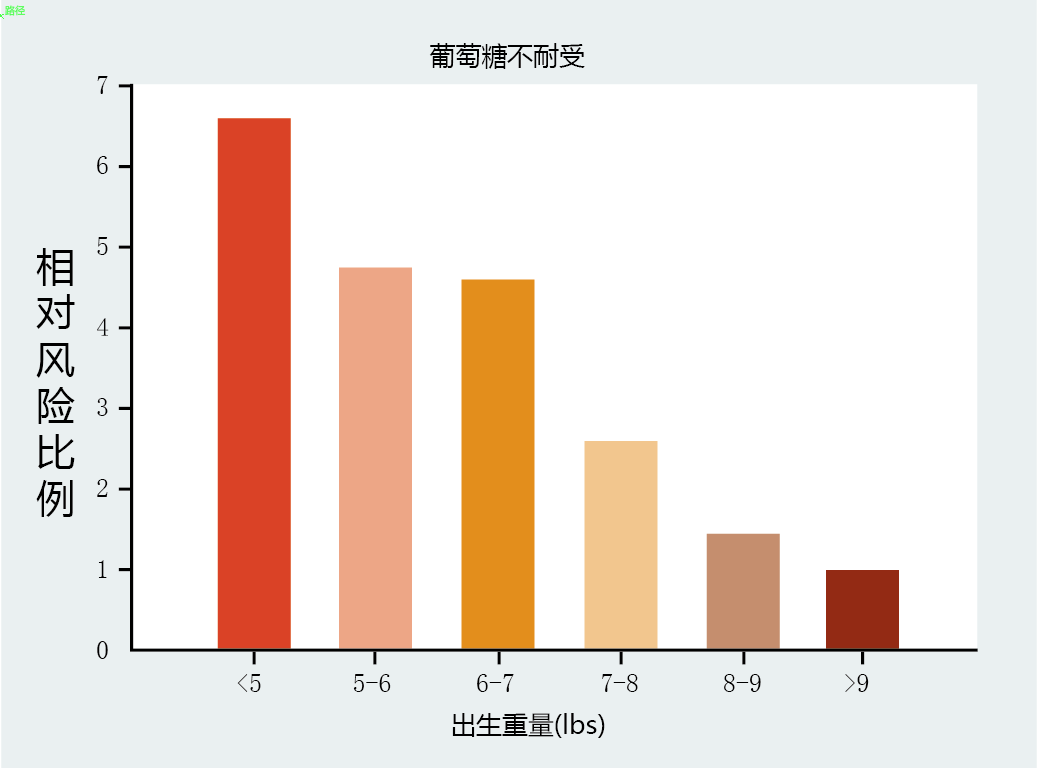
Recent studies have shown that fetal development and the shaping of the phenotype can have a significant impact on physiological function and disease during adulthood. In the 1990s, a group of scientists in England, led by Dr. David Barker, compared the birth weights of 16,000 men and women born between 1910 and 1930 with the incidence of adult disease. These scientists found that low birth weight at full term was highly correlated with the incidence of diabetes in adulthood
(Figure 2.3). The relationship remained even after the researchers removed, statistically, the effects of adult lifestyle choices on this disease. Two decades of animal experimentation have now confirmed that poor nutrition during fetal and early life development establishes a phenotype that leads to poor health outcomes in adulthood. These facts strongly suggest that determining a biomarker of aging and, thus, the individual rate of aging will include teasing out factors occurring during development that have an influence on the extrinsic rate of aging.
Figure 2.3 Risk of developing adultonset diseases as a function of birth weight. Low birth weight is associated with a greater risk of developing glucose intolerance, a prelude to type 2 diabetes, during adulthood. The relative risk ratio is a statistical estimate for the strength of association between a risk factor (birth weight) and the outcome of interest (glucose intolerance). The higher the number the greater the risk for developing the disease. (Adapted from C.N. Hales et al., BMJ 303:1019–1022, 1991. With permission from British Medical Journal.)
Once the individual has developed to the point of having enough physical and cognitive ability to survive on his or her own, the genotype that determines survival to reproductive age and the passing on of the germ line becomes dominant. Biologically speaking, we become very good at resisting the hazards of the 环境. The incidence of cancer, heart disease, diabetes, and other potentially lethal diseases that have an 环境al component is very low during the run-up to puberty.
Even nonlethal hazards are less traumatic in the young. Think about how much better a 10-year-old recovers from a broken arm than an 80-year-old.
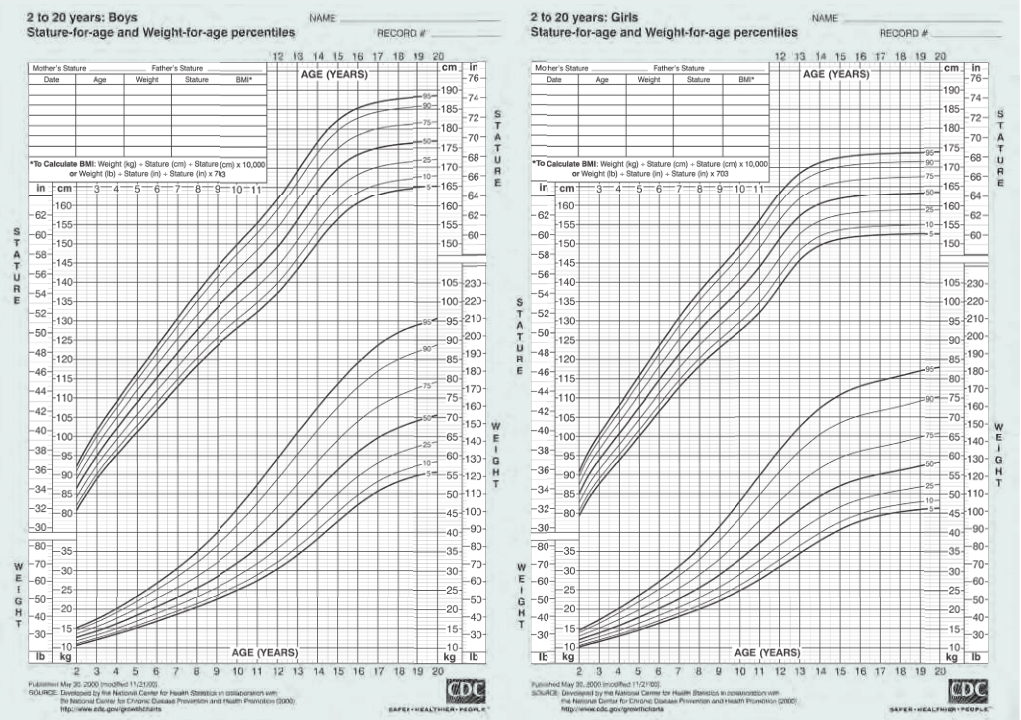
Because the genotype resists 环境al hazards during growth and development, the variation in phenotype among individuals is at its lowest. This makes measuring an individual child‘s biological age easy and precise. Pediatricians have a wealth of data that provide accurate biomarkers for proper growth and development. Even the simple measurements of body weight and height for individuals between the
ages of 2 and 20 are excellent biomarkers for development (Figure 2.4).
Figure 2.4 Clinical growth charts. These charts of height and weight provide a mechanism for measuring age-related growth and development. For example, if a 2-year-old child has a body weight that falls along the 75th percentile curve, there is a 97.5% chance that he or she will remain in that percentile at age 20. Any significant deviation can alert health professionals to a possible problem in growth and development. (From the National Center for Health Statistics, in collaboration with the National Center for Chronic Disease Prevention and Health Promotion, 2000.)
These measurements done on an individual over several years accurately describe age-related biological mileposts, as well as whether or not the child‘s growth and development are on track. As we age beyond the early reproductive years, our resistance to environmental hazards begins to wane. The immune system becomes less effective, the healing process slows, and the functioning of brain centers that help us avoid hazards, such as maintaining balance, declines. An important point here is that the rate of age-related change in a particular cell, tissue, or organ does not follow any predictable age-related pattern, or at least none that biogerontologists have yet identified. Moreover, the physiological system that may have the least resistance to 环境al damage differs from person to person. In other words, as we grow older, the phenotype becomes increasingly unique to the individual and makes finding a biomarker challenging. Separating out how different 环境s affect the rate of aging has, as yet, been the major challenge in identifying biomarkers.
2.1.2 Lifestyle choices significantly affect phenotype
Humans have the unique ability to control their 环境 and thus have some say in how the age-related phenotype develops. Let's use skin aging to illustrate this point. Skin undergoes many age-related changes that are genetically determined and are generally accepted as a common part of intrinsic aging. Most notable are the loss of subcutaneous fat, the fat layer between the skin and muscle, and the decline in elasticity. Together, loss of subcutaneous fat and loss of elasticity result in wrinkles. The 环境 can also affect the development of wrinkles. A person living in the desert will, on average, expose his or her skin to more solar radiation than an individual of similar complexion living in a region of comparable elevation that has more cloud cover. The desert-dwelling human will be at considerably greater risk for skin damage, due to the higher level of radiation, and for the development of wrinkles than the individual living in a location with less sun. The question then becomes, How much skin aging is due to intrinsic factors—that is, biological aging—and how much is due to 环境 or extrinsic aging?
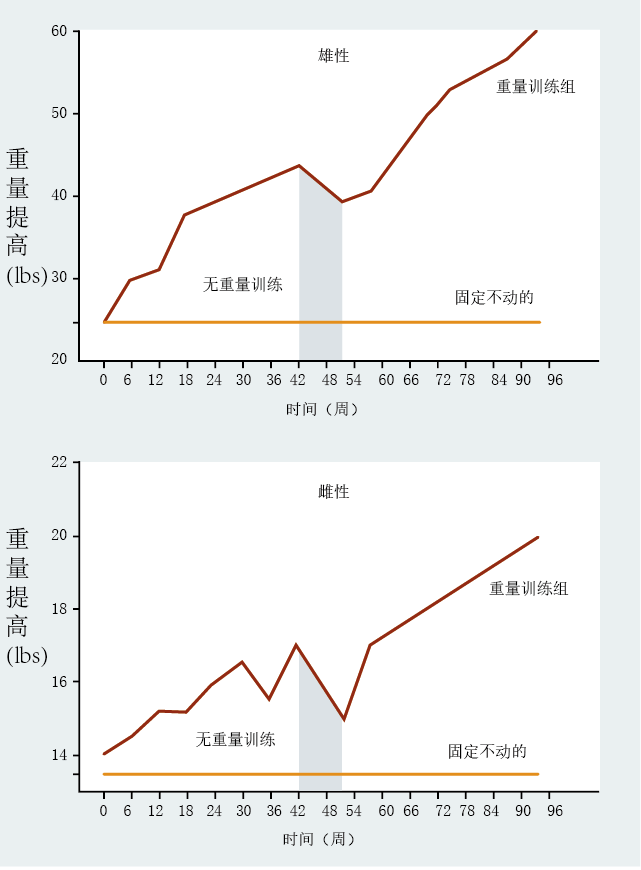
Humans also have the ability to be proactive in slowing the rate of aging and the development of age-related disease. For example, the first studies evaluating age-related decline in muscle strength were done on sedentary individuals and found that muscle strength declined, on average, 30–50% from age 30 to age 80. While subsequent studies showed that the age-related decline in muscle strength has an intrinsic component, individuals participating in weight-lifting exercises can improve strength (Figure 2.5) . This suggests that the age-related decline in muscle strength also reflects our lifestyle choices. Exercise and proper diet also slow the rate of age-related functional loss in the cardiovascular, neural, and skeletal systems, as well as affect bodyweight regulation. The choice to maintain a healthy weight through exercise and diet delays or prevents heart disease, diabetes, osteoporosis, and certain types of cancer. Again, biogerontologists are faced with the problem of determining how much of normal aging results from intrinsic factors and how much from things we do to ourselves.
Figure 2.5 Effects of weight training on age-related decline in muscle strength. Individuals between the ages of 60 and 80 years who participated in a two-year weight-training program (brown line) showed significant gains in strength compared with sedentary persons of similar age (orange line). These data clearly demonstrate that the normal age-related loss in muscle strength has an extrinsic component. Note that between weeks 42 and 52, the training was suspended. (Adapted from N. McCartney et al., J. Gerontol. Ser. A Biol. Sci. Med. Sci. 51: B425–433, 1996. With permission from Oxford University Press.)
2.1.3 The表观基因组can also affect the rate of aging and 寿命
So far, we have introduced the principles of genotype and the age-related phenotype by considering regulation of gene expression at the level of genomic DNA (the sequence of base pairs). A second level of trait development, known as the epigenome (epi- is Greek for “above” or “in addition to”), also affects development of the phenotype and thus can affect the rate of aging and longevity. The resulting phenotype is called an epigenetic trait, a phenotype resulting from changes in a chromosome without alterations in the DNA sequence. The cell uses
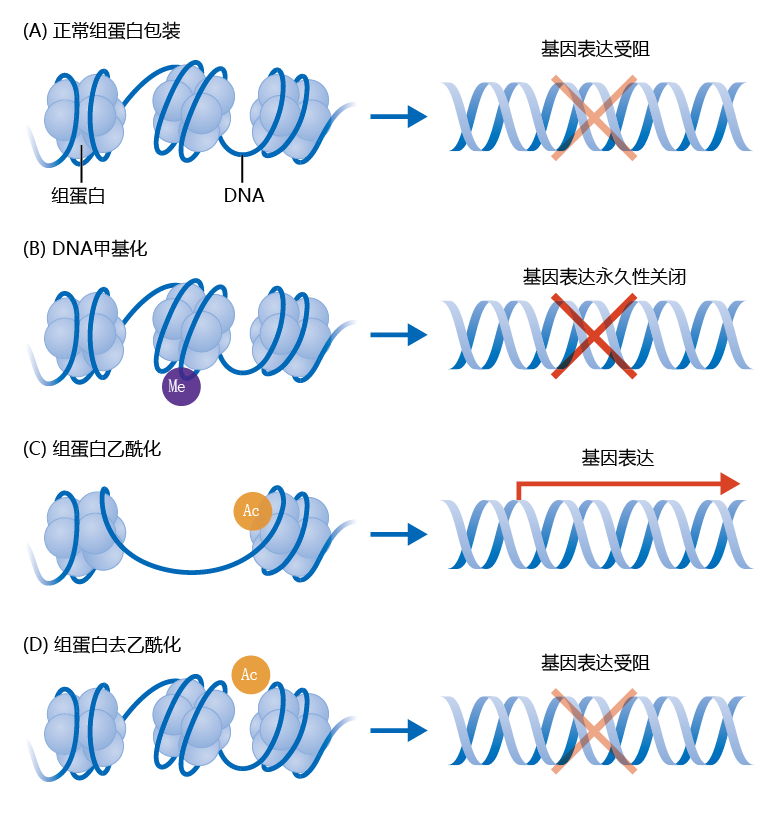
several methods to regulate gene expression through the epigenome. The two most common are DNA and histone methylation and histone acetylation-deacetylation. DNA and histone methylation processes work by the same mechanism, and in this text both are referred to as DNA methylation. Histones are 蛋白质 that help compact the doublestranded DNA to fit it inside the nucleus (Figure 2.6) . That is, DNA in its extended strand form is much too big to fit into the nucleus. You will learn in Chapter 5 how the unwinding of DNA from the histone 蛋白质 regulates gene expression. Simply put, the DNA must unwind from the histone before the gene can be expressed.
Figure 2.6 Mechanisms of epigenetic regulation of gene expression. (A) The DNA in the eukaryotic nucleus is wrapped around histone 蛋白质. Gene expression occurs when the DNA disassociates from the histone. (B) The methylation (Me) of DNA on the histone permanently turns off gene expression for a specific gene by preventing the disassociation of DNA from the histone 蛋白质. (C) Histone acetylation-deacetylation is an epigenetic mechanism that assists in the unwinding and winding of the DNA on the histone. Acetylation stimulates gene expression. (D) Deacetylation inhibits gene expression.
About 90% of the epigenome consists of an inherited pattern of methylation (addition of CH 3 groups) of DNA that occurs during fetal development. DNA methylation causes gene expression of that DNA region to be permanently turned off, by preventing the unwinding of the DNA from the histone; this methylation cannot be reversed. DNA methylation is critical to cellular differentiation during fetal development and takes place primarily in non-mitotic cells, cells that do not divide. Methylation of DNA makes sure, for example, that a muscle cell expresses only genes important to muscle function by permanently turning off genes that are used in other types of cells (so that, for example, liver enzymes are not produced in a muscle cell). The mechanism underlying how the methylation pattern leading to epigenetic traits is inherited remains to be fully described.
The other 10% of the epigenome allows for an epigenetic trait to arise sometime during the life span, including during fetal development—that is, these traits are not inherited. This part of the epigenome appears to be influenced heavily by 环境al conditions. Histone acetylation probably has its greatest influence at this level of the epigenome. Adding an acetyl group (CH 3 CO) to the histone 蛋白质 unwinds the DNA and encourages gene expression. Removal of the acetyl group, known as histone deacetylation, causes the DNA to rewind onto the histone 蛋白质 and inhibits gene expression (Figure 2.6C, D). The ability to acetylate and deacetylate the histone means that this epigenetic mechanism for regulating gene expression is, unlike methylation, reversible.
Research into the epigenetic effect on the phenotype has been focused, almost exclusively, on mechanisms associated with DNA methylation during fetal development. Only recently has significant research focused on epigenetic effects that influence the adult phenotype; even less attention has been given to the aging phenotype. There is some evidence that the epigenome affects longevity. As you will learn in Chapter 5, inhibition of gene expression through histone acetylation deacetylation in simple organisms such as budding yeast and worms can affect life span. Moreover, the finding that these epigenetic effects are influenced directly by population density and food availability indicates that specific 环境al conditions are important to the development of the aging phenotype.
2.1.4 Cross-sectional studies compare changes in different age groups at a single point in time
Identifying a reliable marker of biological age in the individual often starts by using cross-sectional investigations. Cross-sectional studies compare the average or mean rate of change in a particular physiological system in two or more age groups, known as cohorts, at a single point in time. These experimental designs are widely used in biogerontological research. Cross-sectional investigations have several
advantages, including simplicity of design and low cost, and they provide good general descriptors of an age-related biological phenomenon.
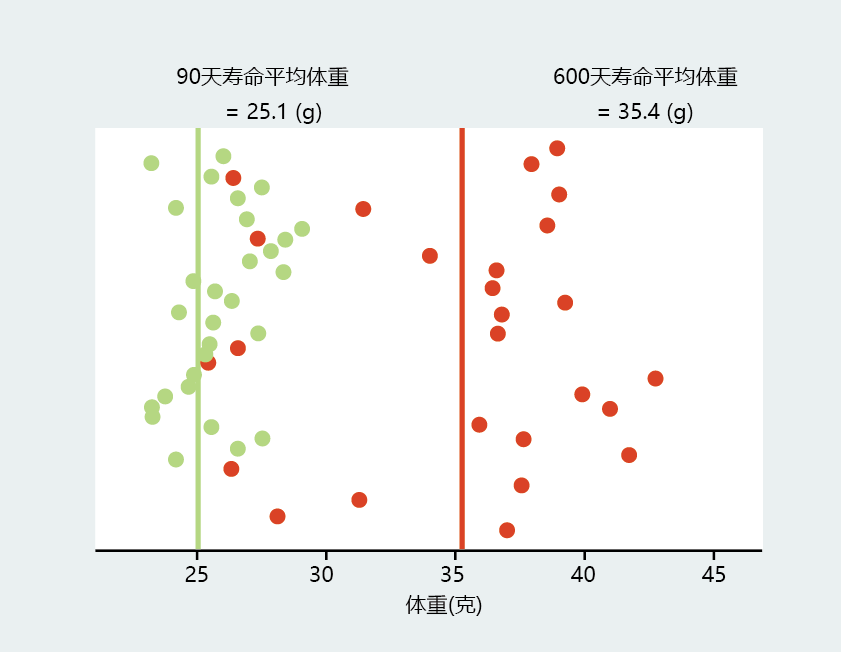
Cross-sectional studies have added significantly to our knowledge about which biological factors may affect the rate of aging in an individual. However, the results of cross-sectional studies reflect the comparisons of means or averages and are not specific to the individual (Figure 2.7). Some individuals may have values for the study variable that are very close to the mean, while others may have values that fall a significant distance from the mean. Moreover, the data spread about the mean
becomes larger with age. Even when the data are collected under conditions that largely eliminate variability associated with the environment, significant variability may remain. Because of this intrinsic variability, cross-sectional studies have limited precision in identifying a biomarker for aging.
Figure 2.7 Cross-sectional studies reflect comparisons of means or averages and are not specific to the individual. Shown here are two sets of data: the body weights of 30 mice at 90 days of age (green circles) and the body weights of the same mice at 600 days of age (red circles). Note that, compared with the younger mice, the older mice have a much greater spread of values contributing to the mean. (3 mice died before 600 days of age.)
By definition, a cohort consists of a group of individuals who have, in general, similar life experience. That is, a cohort is more than just people of similar ages. These life experiences, especially those that may affect the rate of aging, may differ significantly between cohorts, and this introduces into the study a variability that cannot be easily controlled. This variability is known as the cohort effect. To illustrate
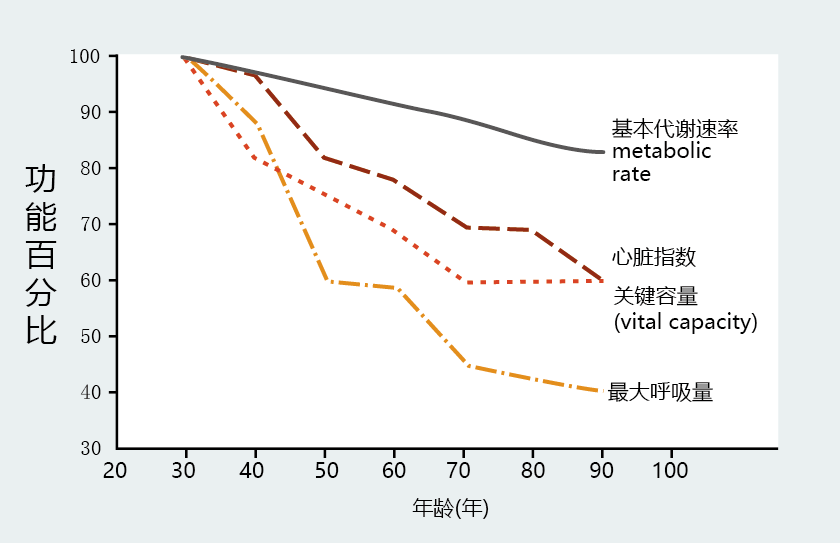
the cohort effect, consider the data obtained from a cross-sectional investigation such as that shown in Figure 2.8. These data suggest that physiological function, as described by several biological markers, declines between 30 and 90 years of age. Now consider the life experiences of each cohort. At the time of publication of these data in 1959, the oldest group, consisting of 90-year-olds, would have spent much
of their life without the benefits of modern medicine. Infections, for example, were treated by removing the tissue affected, and infectious diseases were treated by removing the individual from the population. Conversely, individuals in the group of 30-year-olds were born during a time of rapid advancements in medicine that significantly reduced the spread of disease and prolonged life. There is simply no way to predict or control for the effect of medical knowledge on the age-related
phenotypes of these two groups. In other words, the results may more closely reflect the difference in the cohorts‘ life experiences than any difference in the age-related phenotype.
Figure 2.8 A 1959 cross-sectional investigation describing physiological function in different age groups. Basal metabolic rate, cardiac index (a measure of heart function), vital capacity (the largest amount of air expelled after a person‘s deepest inhalation), and maximal breathing capacity (the volume of air that can be breathed over a few seconds when a person breathes as deeply and quickly as possible) were measured (as a percentage of function at 30 years old) in groups aged between 30 and 90 years. The cohort effect may account for some of the differences in function between the 30- and 90-year-olds. (Adapted from B.L. Strehler, Q. Rev. Biol. 34:117–142, 1959. With permission from University of Chicago Press.)
Finally, conclusions based on cross-sectional analysis may be confounded by the effects of selective mortality, that is, the inclusion of individuals who, because of a different genotype, may have a different mortality rate (defined as the number of deaths in a population at a given time, in a given group or from a given cause) than the average population. Individuals included in the 60- to 90-year-old groups shown in Figure 2.8 were born when life expectancy at birth was 40–45 years. These individuals had already outlived, at a minimum, 50% of their birth cohort at the time of measurement. Those in the 90-year-old group represented less than 1% of their birth cohort. Thus, these age groups are not a representative sample of the entire age cohort and may have outlived their contemporaries due to some factor(s) not
present in those individuals who had died. The results of this cross-sectional investigation may be biased by selecting only “hardy” individuals representing advanced age.
2.1.5 Longitudinal studies observe changes in a single individual over time
The collection of data from the same person over several years is the method used in longitudinal studies, a study design that was intended to measure more accurately the rate of aging in an individual. However, longitudinal studies have been no more effective than cross-sectional analysis in identifying a biomarker of aging. This fact has been demonstrated nicely by the Baltimore Longitudinal Study of Aging (BLSA), the longest continually running longitudinal study on aging in the world. The BLSA began in 1958 with the specific aim of describing “normal” human aging. To this end, the lead investigators selected a homogeneous population in order to minimize the influence of the 环境 on the rate of aging. By 1984, it was apparent to the investigators that the concept of normal aging was a fallacy. They showed that even in individuals who had incomes and educations providing access to the best of health care and information on health care, the rate of aging was random with respect to timing and physiological system affected. The researchers stated that the “BLSA data indicate that aging is a highly individual process. . . . In some variables, individual 80-year-old subjects may perform as well as the average 50-year-old. Aging is highly specific not only for each individual but also for different organ systems within the same individuals” (Shock et al. 1984). The results of the BLSA were so unambiguous that ongoing longitudinal studies, including the BLSA, no longer have as their primary objective to describe normal human aging. Rather, ongoing longitudinal studies and the cross-sectional data derived from them are now focused on describing aging in populations of individuals that share specific attributes (TABLE 2.1) . Thus, large-scale longitudinal studies that started as a mechanism for defining aging in the individual have instead been more effective at describing long-term changes in populations of individuals with similar backgrounds.
TABLE 2.1 SELECTED ONGOING LONGITUDINAL STUDIES OF AGING
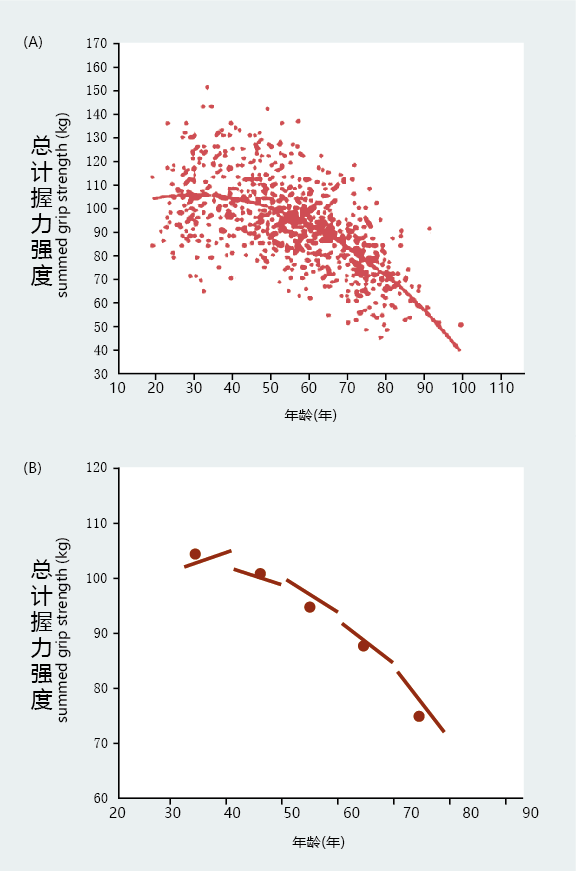
Even though longitudinal studies are no more effective at identifying a biomarker of aging than are cross-sectional designs, they continue to contribute significantly to the study of aging. An important use of many longitudinal studies has been to demonstrate more accurately than cross-sectional studies the pattern of individual aging in a population. For example, the cross-sectional results shown in Figure 2.8 suggest that the rate of aging after 30 years of age conforms to a linear decline. But, as shown in Figure 2.9A , longitudinal analysis finds that functional decline occurs at nonlinear rates and appears to be closely linked to the end of the reproductive life span rather than to calendar time. You will learn in Chapter 3 that the reproductive schedule of a species has a major influence on the rate of aging and longevity.
Figure 2.9 Studies of grip strength using two methods of analyzing longitudinal data. (A) Longitudinal data showing that the rate of aging is nonlinear. The spread of individual data points was fitted to a nonlinear equation by using the entire population. In addition, the graph clearly shows that the start time and amount of decline in grip strength are highly variable. (B) A cross-sectional analysis using means computed from multiple measures made on individuals within each age cohort. The means are represented by the midpoint of the line segments. The direction of each line segment (left to right) indicates a gain or loss in grip strength over the decade of measurement for that age cohort. The length of the line segment represents the length of time the longitudinal data were collected. The graph also shows that the rate of physiological decline is nonlinear with respect to time, in agreement with the longitudinal data in (A). This demonstrates that cross-sectional studies performed within the framework of the longitudinal design eliminate many of the problems associated with earlier crosssectional analyses. (From D.A. Kallman et al., J. Gerontol. 45:M82–88, 1990. With permission from Oxford University Press.)
Another significant contribution of longitudinal studies to the overall progress in aging research is their ability to generate and maintain data from humans with well-documented life histories. Knowing the life history of a subject allows for the identification of 环境al factors, such as disease, physical activity, diet, and so on, that can mislead a researcher into concluding that there is an aging effect when, in fact, the change was driven by 环境al factors. Such detailed life-history information cannot often be collected in one-time, cross-sectional studies in humans, and this is normally only possible when using laboratory animals as models for human aging(BOX 2.1). As a result of the detailed knowledge about the study subjects, the cohort effect and selective mortality are eliminated in cross-sectional designs that use participants in longitudinal studies. That is, the validity and reliability of results from cross-sectional experiments are significantly enhanced when they are conducted using subjects involved in longitudinal studies (Figure 2.9B).
|
BOX 2.1 EVALUATING BIOGERONTOLOGICAL RESEARCH IN ANIMALS As a biological science, biogerontology frequently uses animals as models for humans. Animal models provide a system to measure aging under controlled conditions and to establish the basic mechanisms of a biological process. These types of studies are critical for constructing hypotheses and research methods for aging studies in humans. Thus, performing experiments in laboratory animals, within accepted good practices, is essential to biogerontological research. Knowing some of the good practices used in biogerontological animal research will help you better interpret the validity of research results. Summarized here are four practices to keep in mind when you are reading about aging research that uses laboratory animals, particularly those used as models for human aging. General practice 1: Researchers should know the life history of the animal model being used Biogerontologists should have a thorough knowledge of the normal biological events that take place in their animal model throughout its life span, often referred to as its life history. At a minimum, there are three important life-history events that should be known precisely: (1) the approximate age at which the species reaches the end of its developmental growth; (2) the mean life span; and (3) the maximum life span. For the investigator conducting cross-sectional investigations, this information prevents the inclusion of groups of animals that are either too young or too old. Including animals that are too young can lead to conclusions about an aging effect, when, in fact, the observed difference is the result of factors unique to the animal‘s developmental stage. Using animals that are too old can result in conclusions about aging, when the findings actually apply to only a subset of animals that have reached old age because of a genetic factor not found in the majority of the population—that is, selective mortality. General practice 2: Researchers should know the reproductive life span of the animal model Throughout this textbook, and especially in Chapter 3, we emphasize that genes selected for survival to reproductive age influence both the rate of aging and the species' maximum life span. In choosing an animal model for biogerontological research, the researcher should give careful consideration to factors that affect development up to reproductive age, as these factors will significantly affect the rate of aging and longevity. Conversely, knowing the approximate age when the reproductive stage of the life span begins to wane can help an investigator select an appropriate age group to “look” for greatest aging effects. General practice 3: Researchers should carefully maintain and clearly report the 环境 in which animals are housed As you have seen, the 环境 can affect the age-related phenotype and the extrinsic rate of aging. One of the primary reasons that biogerontologists use animals as models for human aging is so that they can control, to a large degree, the environment to which the animals are exposed. This limits the impact of extrinsic factors on the rate of aging. Good practices in biogerontological research require that the research animals be maintained behind barriers that provide filtered air, flowing at a positive pressure with respect to the external 环境 (Figure 2.10). This helps prevent airborne contaminants entering the animals' 环境. Bedding and food should be sterilized, and the water slightly acidified and chlorinated. All substances entering the animals' housing should be tested periodically for contaminants. Finally, each colony should contain animals, known as sentinels, that are used to monitor populations for infectious disease pathogens. The sentinel animals are housed with the experimental animals and exposed to the same 环境al conditions, and are routinely tested for exposure to infectious agents. Any contamination must be noted when reporting the findings, so the reader can determine whether these issues may have affected the results. General practice 4: Researchers should assess pathology and cause of death in research animals No organism dies of old age. Rather, each organism dies of a specific cause or a combination of lethal pathologies. The investigator should have a clear understanding of the biological factors that led to the death of each animal, for two reasons. First, the cause of death or age-related pathology provides researchers with information on how the environment affected their models. The cause of death or age-related pathology should be inherent to the animal, not a consequence of environmental contamination. Second, performing a thorough necropsy and histochemical analysis establishes the normal age-related pathologies specific to that species and whether or not those pathologies are also seen in humans. Such knowledge helps other investigators choose the correct models for their experiments. Figure 2.10 A laboratory barrier unit. Barrier units help prevent airborne contaminants from entering the animals‘ 环境. (Courtesy of Jennifer Ruhe, Department of Nutrition, University of California.) |
2.1.6 Personal genomics will probably be the key to determining and applying biomarkers for衰老
Throughout this section we have emphasized that the rate of aging may be unique to each individual and that this uniqueness poses significant obstacles to establishing a biomarker for aging. Even the best-designed longitudinal studies have been unable to identify a “normal” marker of aging. We noted that the rate of aging may be determined early in the life span, during fetal development. And we saw how epigenetic effects occurring during adulthood influence the phenotype. The current evidence leads to the general conclusion that the aging phenotype may
most closely reflect a gene or groups of genes that are highly malleable to 环境al interactions throughout the life span, including fetal development. You will see in Chapter 5 that, using animal models, biogerontologists are beginning to identify genes and/or epigenetic effects that respond to 环境al changes during fetal and early life development and that also affect the length of life. It is simply a matter of time until gene homologs (DNA sequences of one gene that match those of a second gene, even a gene of a different species) are identified and tested in humans. Once genes have been identified that may affect the rate of aging, we can then use personal genomics, the analysis of individual genotypes or epigenetic mechanisms, to identify whether “rate of aging” genes or some polymorphisms of those genes exist and are being expressed or inhibited. Having such knowledge will allow health professionals to make recommendations at the individual level about ways to slow the rate of aging.
Personal genomics is currently being used to determine the probability of developing lethal genetic diseases. The limited use of personal enomics reflects the $10,000–$20,000 price tag for having a genome sequenced. Experts agree, however, that within 10–15 years the price will drop to a level at which widespread use of personal genomics will become possible. We now stand at a time in history when our knowledge of the factors that determine the rate of aging is sufficiently advanced that by using current technology—personal genomics—identification of a reliable marker to measure aging in the individual will soon be accomplished.


