7.2 20世纪人类寿命延长的兴起
The science of biodemography has provided the theoretical framework suggesting that intelligence is the underlying reason for humans' unique trajectory in mortality rates and life span. This unique trajectory, however, did not arise “instantaneously,” 1–1.2 million years ago, with the increase in brain size that accompanied the speciation of H. sapiens from H. erectus. Rather, humans had to develop socially and culturally before their advanced intelligence could operate to affect life span and mortality rates. For example, the sharing of information through oral and archaic written forms was essential to the spread of agricultural techniques that reduced starvation in hunter-gatherer societies. The transfer of this information from one group of people to another required the establishment of routes linking geographical regions, a process that necessitated the use of simple engineering skills that could be developed only with human intelligence. (See Chapter 1 for a discussion of how insects are being used to study the impact of social groups on longevity and mortality.)
The pace of knowledge accumulation that led to extended life span was rather slow throughout most of human history. The pace of discovery in biology and medicine quickened during the seventeenth century as the Age of Enlightenment progressed. The shift from largely agrarian societies to industrial economies required a more educated workforce. As education for the masses expanded, so did technology. Medical technology, such as the microscope, led to the discovery of bacteria and, eventually, to public health policies that reduced the spread of infections and increased life span.
At the beginning of the twentieth century, the technology created by human intelligence profoundly reduced the incidence of lethal diseases and increased life span. In a single 30-year period, from 1920 to 1950, the average human life span increased by more than 75%. Many demographers and biodemographers believe that this great leap forward in longevity placed our species on a new evolutionary track from that experienced just 100 years earlier. In this section, we examine the reasons for the unprecedented rise in human life span during the twentieth century. We begin with a brief look at life spans in historical societies, then discuss the rise of modern biological inquiry and how this led to the mortality rates and extended life spans observed in the developing countries of today.
7.2.1 For most of human history, the average human life span was less than 45 years
Determining the average human life span in historical populations can be difficult. The construction of life tables and determination of ageadjusted life expectancy did not begin until 1750–1800. Estimations of mean and maximum life span prior to that time are compiled from indirect data such as skeletal remains, tombstone inscriptions, and records of religious rituals. The accurate determination of age in skeletal remains depends, to a large degree, on the state of bone ossification. Individuals with poor ossification, such as the very young and the very old, tend to have faster rates of bone decomposition after death, which makes age determination difficult. Life-span data generated from skeletal remains tend to overestimate mean life span and underestimate maximum life span. Age of death determined from tombstone inscriptions may be unrepresentative of the entire population, as only some of the population may have been wealthy enough to afford a tombstone. Gravesite data also exclude cultures in which cremation was generally preferred to burial.
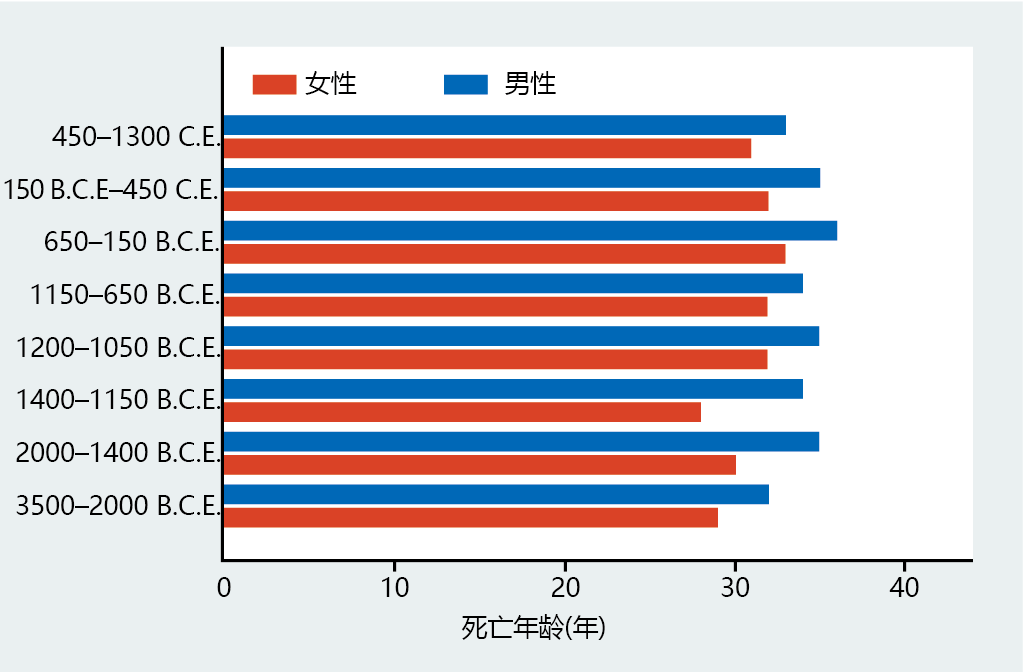
Despite the limitations in determining age prior to the recording of vital statistics, we know from archeological evidence that from the Neolithic Period (~5000 b. c. e.) to the Enlightenment (beginning ~1600 c. e.), the average human life span remained fairly stable at 30–40 years (Figure 7.6). Age estimations made from suture closing in skulls recovered from a Greek cemetery, dated between 3500 b. c. e. and 1300 c. e., show a mean age at death of 32–38 years for males and 28–33 years for females. While no skeletons over the age of 60 were found in this gravesite, tombstone inscriptions from ancient Roman cemeteries indicate that a few individuals lived into their eighties and nineties. Thus, while mean life span was only half of that seen in economically developed countries today, the Roman cemetery inscriptions suggest that maximum life span potential may have been similar.
Figure 7.6 Mean age at death of males and females as estimated from skeletal remains recovered from a Greek cemetery. Individuals in this sample died between 3500 b. c. e and 1300 c. e. The data show that mean life span hovered around 30–35 years for most of human history. (Data from G.Y. Acsadi and J. Nemeskeri, History of Human Life Span and Mortality, Budapest: Akademiai Kiado, 1970, p. 346.)
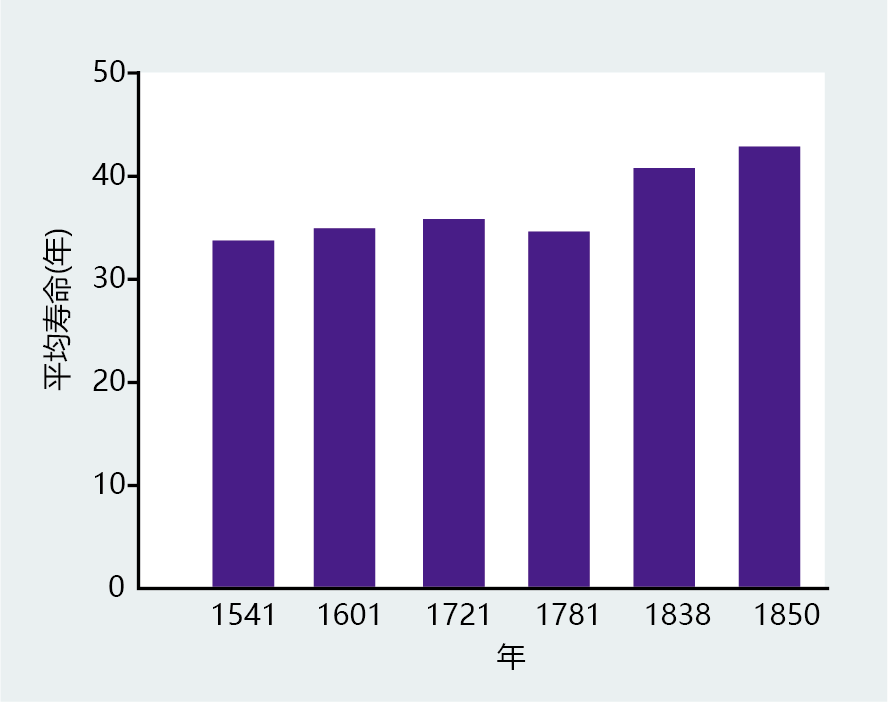
The fall of the Roman Empire in ~500 c. e. and the ensuing breakdown of an organized governing structure resulted in the loss of the census data needed to construct reliable life tables for more than 1200 years. Accurate census recordings of the general population did not begin again in Europe until around 1850. However, the Church of England began keeping Christian baptismal and death records of their members in 1541, and these records have been used to determine mean life span prior to 1850. These data show that mean life span had increased only moderately from the gravesite data in Greece and Rome, to 30–45 years (Figure 7.7). Thus, based on data collected between 3000 b. c. e. and 1850 c. e., mean life span was less than 45 years of age throughout most of human history. Although biodemographic deductions have shown that early humans had a brain size similar to that observed today, that human intelligence did not contribute significantly to extended life span, at least until 1850 c. e.
Figure 7.7 Mean life span in England and Wales as determined from records of the Church of England. (From W.E. Smith, Human Longevity, New York: Oxford University Press, 1993. With permission from Oxford University Press.)
7.2.2 Control of infectious diseases increased mean life span
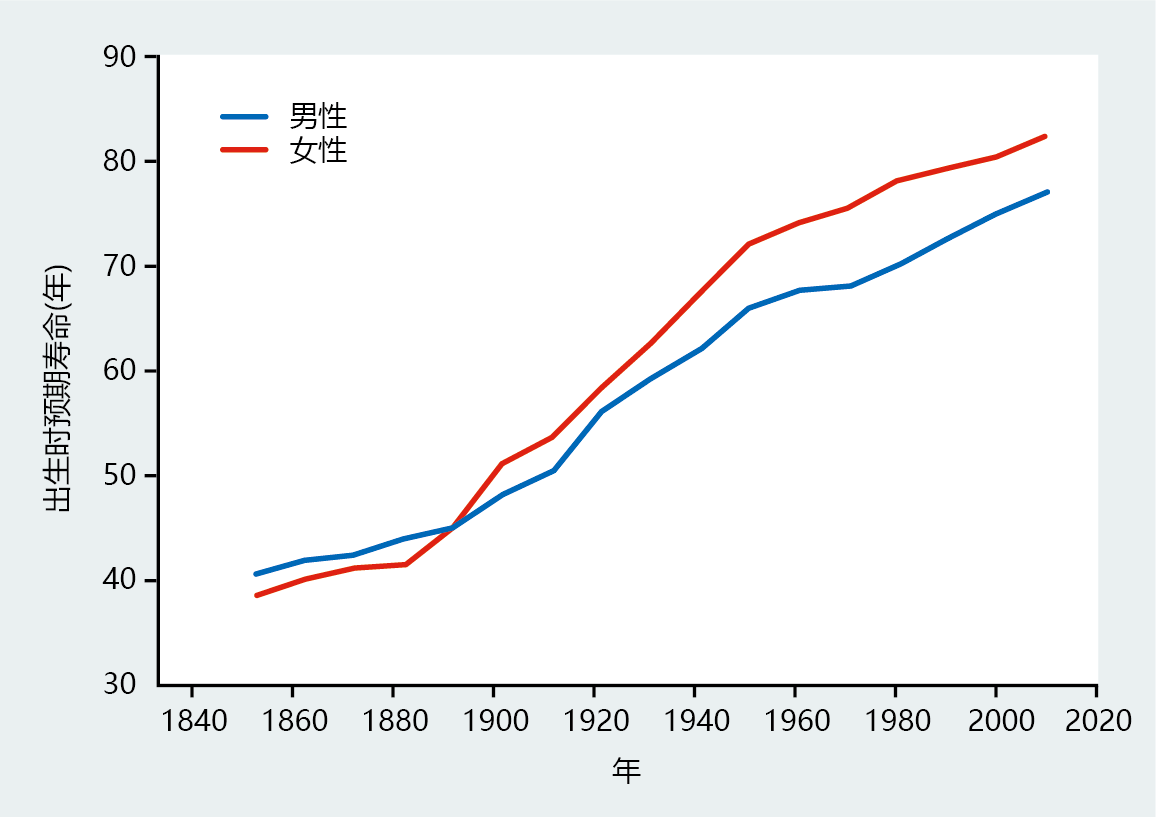
A change in the pattern of mean life span in England seems to have begun somewhere around the beginning of the nineteenth century. Mean life span in the United States started to increase steadily around 1840 (Figure 7.8), an increase directly related to invention of the microscope and the discovery of bacteria by Anton van Leeuwenhoek in 1676, a time when infectious diseases were the number one cause of death throughout the world. The discovery of bacteria and the development of microbiology in the 1700s gave rise to the understanding that bacteria were the cause of infection. As governments began to establish public health policies, the incidence of infectious diseases began to decline slowly and mean life span began to increase.
Figure 7.8 Life expectancy at birth for males and females in the United States between 1850 and 2010. Notice that life expectancy at birth was similar in males and females until about 1930; this has been attributed to the high level of maternal death during childbirth. When the majority of women began to deliver their children in a hospital, survival increased, as did life expectancy at birth. (From Department of Health and Human Services, National Center for Health Statistics, Natl Vital Stat. Rep. 54:19, 2006, www.dhhs.gov.)
Edward Jenner introduced the first successful vaccination for smallpox in 1811, but widespread inoculation programs did not begin until Louis Pasteur provided the methods for producing large quantities of vaccines in 1880. (Until the discoveries of Pasteur, control of infectious diseases was mainly limited to isolating humans from the sources of bacteria.) In addition, milk pasteurization, first adopted in Chicago in 1908, contributed to the control of milk-borne diseases (e.g., gastrointestinal infections) from contaminated milk supplies. Eventually, procedures were developed for ensuring safe water and the treatment of sewage. Life expectancy at birth began to increase dramatically only after the advent of widespread vaccinations and general acceptance of the need for proper sanitation. Note, in Figure 7.8, the rapid increase in mean life expectancy at birth beginning somewhere between 1890 and 1900.
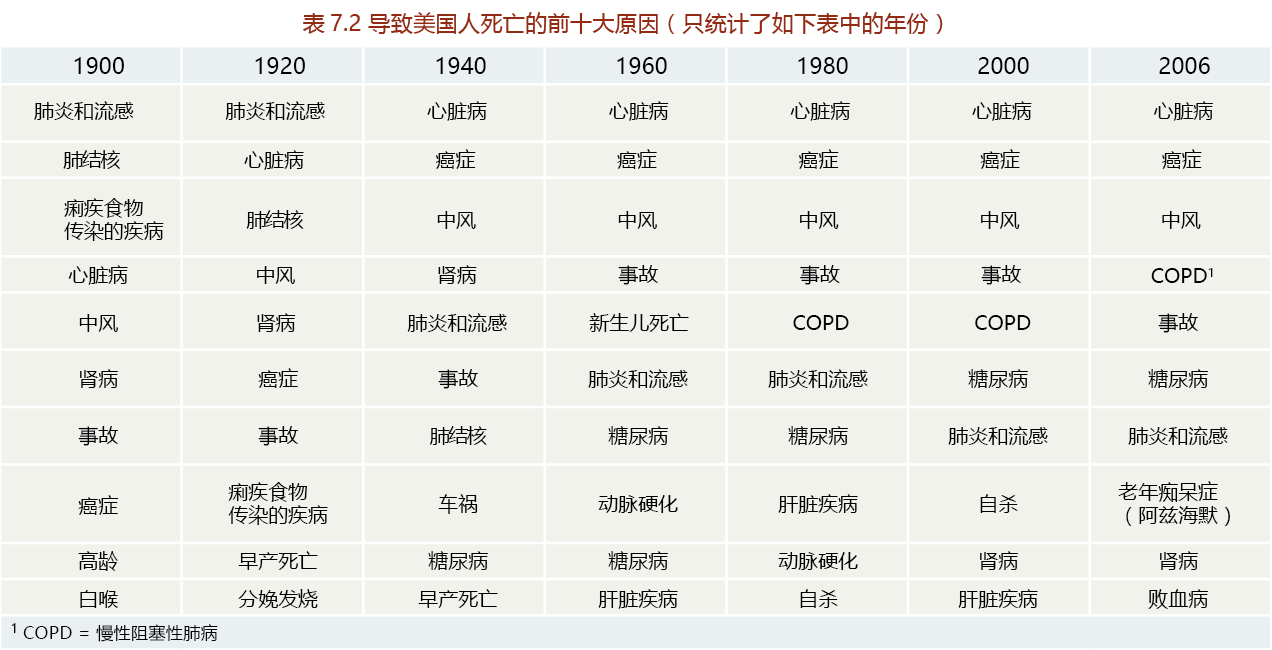
Infectious diseases can affect all age groups equally (though is higher in infants, as described below) resulting in high mortality rates at all ages. For example, the leading cause of death in the United States in 1900 was pneumonia and influenza, followed closely by tuberculosis (TABLE 7.2). The top three causes of death in 1900 were diseases that are now preventable (pneumonia and influenza, tuberculosis, diarrhea and food-borne illness), an observation supporting the contention that infectious diseases and inadequate sanitation led to early death and low life expectancy at birth. Reduction in preventable diseases that have high mortality rates, such as diarrhea and tuberculosis, resulted from government-enforced sanitation and vaccination programs during the latter half of the 1920s. Only pneumonia and influenza remained in the top 10 causes of death in 2006, and their ranking continues to decline as vaccination against influenza becomes more common. The containment of infectious diseases during the 1920s and 1930s led to a significant statistical shift: diseases with a strong genetic component—such as heart disease and cancer—replaced infectious diseases as the leading causes of death. Because diseases with a strong genetic component are more frequent in older age groups, mortality rates at younger ages are reduced.
7.2.3 Decreases in infant mortality increased life expectancy
Mean life expectancy is the statistical probability of achieving a certain age in the future given the current age distribution of the population (see the discussion of life tables in Chapter 2 and Appendix 1). Recall that mean life expectancy at birth is calculated from the ratio of the number of years lived in all age categories and the number of deaths occurring in a particular age category (in this case, 0–1 years). Thus, if the infant mortality rate (0–1 year of age) is high, the number of years lived by all age categories (the numerator of the equation) declines, the death rate for infants (the denominator of the equation) increases, and the mean life expectancy at birth is low. Conversely, a decrease in infant mortality rate increases the number of years lived by all age categories and decreases the death rate for infants, thereby increasing mean life expectancy at birth.
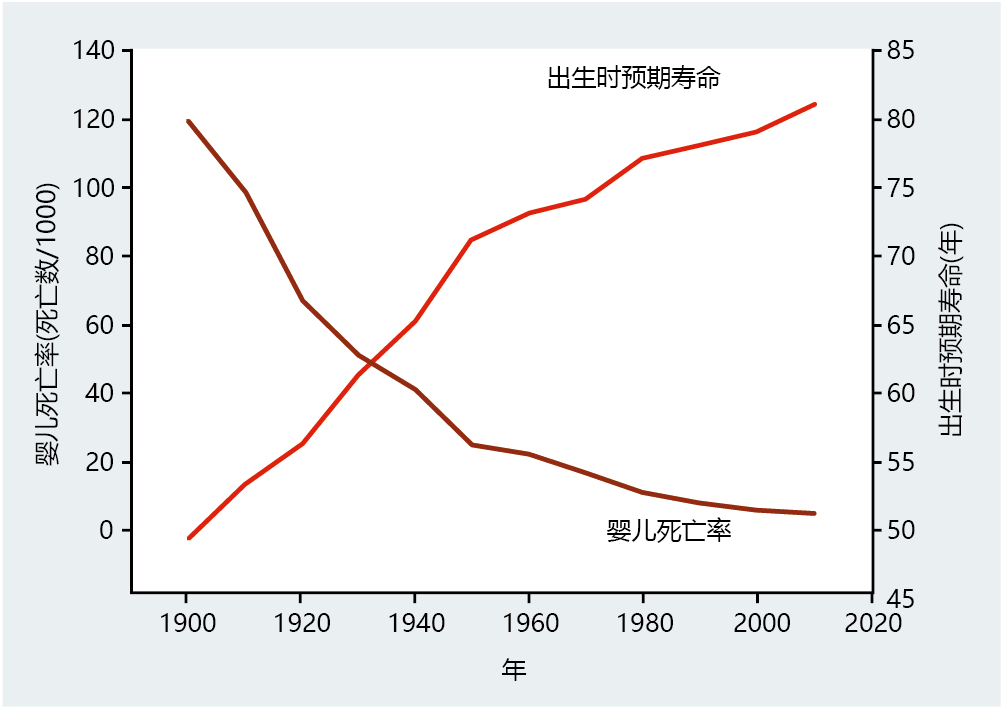
As we've seen, infectious diseases were the major cause of death throughout much of human history. Infants are particularly susceptible to infectious disease, because the human immune system does not fully develop until many years after birth. Infectious diseases were the primary cause of death in infants until the 1920s. Moreover, before 1900, most births took place in the home and were attended primarily by midwives or other individuals who did not have specific medical training. Any complication threatening the life of the infant was, for the most part, left untreated. The high rate of infectious diseases and complications at birth resulted in a high infant mortality rate prior to 1900 (Figure 7.9). The combination of public health programs, widespread inoculations, and hospital births decreased the infant mortality rate and increased life expectancy at birth. Note, in Figure 7.9, the opposing slopes in the infant mortality rate and life expectancy at birth that began around 1910.
Figure 7.9 Life expectancy at birth and infant mortality rate for females in the United States. Decreasing infant mortality was the primary reason for the increase in the aged population until about 1970–1980. (From F.C. Bell and M.L. Miller, Life tables for the United States Social Security area 1900–2100, Washington, DC: Social Security Administration, 2005, p. 194.)
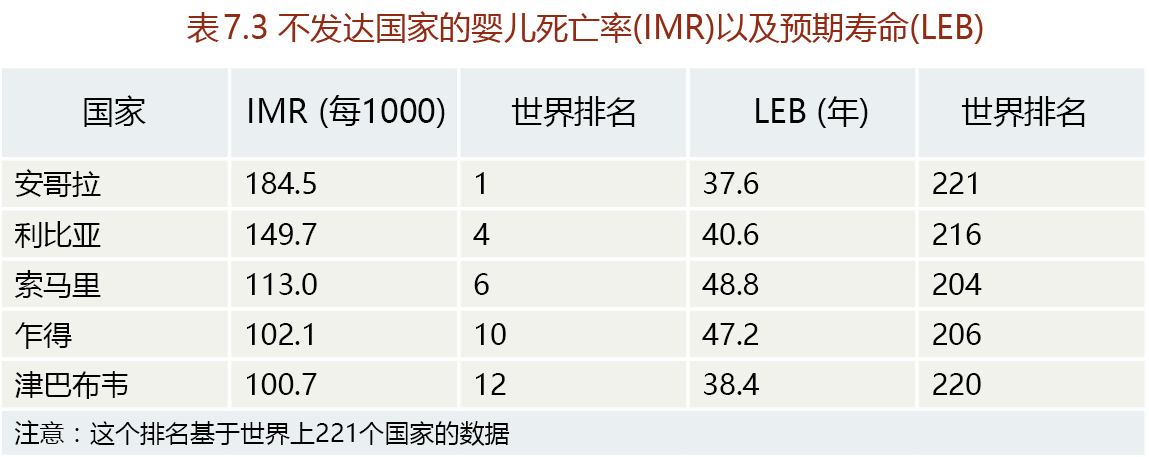
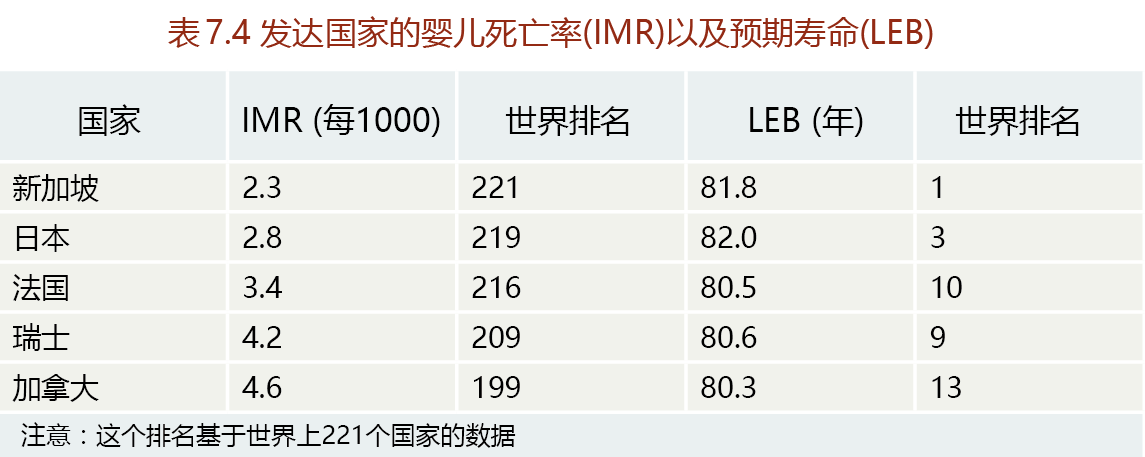
Economically developed countries throughout the world have experienced a pattern of increasing life expectancy accompanied by decreasing infant mortality rate similar to that for the United States. However, high rates of infant mortality continue to suppress life expectancy at birth in less-developed countries (TABLE 7.3 and TABLE 7.4).
For example, Angola has the world's highest infant mortality rate and lowest life expectancy at birth. Conversely, Singapore has the world's lowest infant mortality rate and highest life expectancy at birth.
7.2.4 Improved medical treatments account for the continuing increase in life expectancy
Although the rate of infant mortality in the United States began to flatten somewhere between 1970 and 1980, life expectancy at birth has continued to increase at nearly the same rate as that observed in 1910 (see Figure 7.9). Together, the relatively stable infant mortality rate and the increasing life expectancy at birth indicate that changes in infant mortality are no longer the cause of the continuing increase in life expectancy. Rather, the continuing increase since 1970 reflects improvements in care and treatment for noninfectious, life-threatening diseases in older age groups.
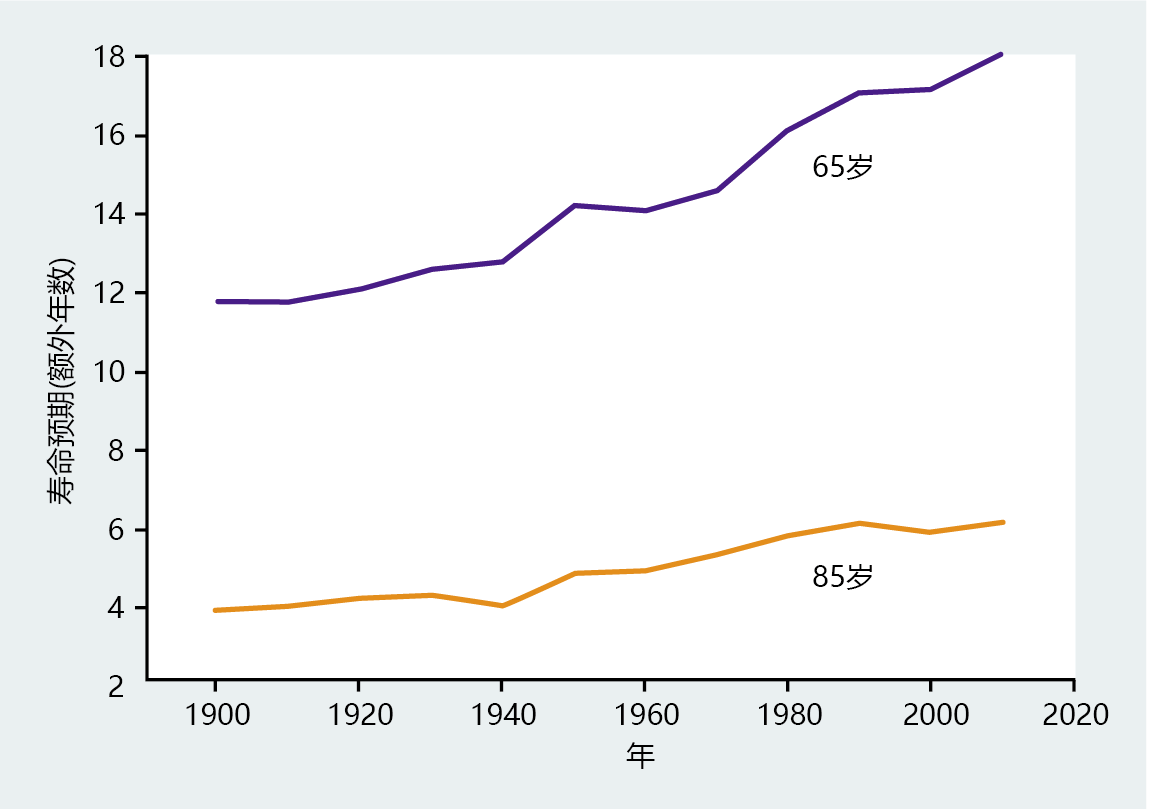
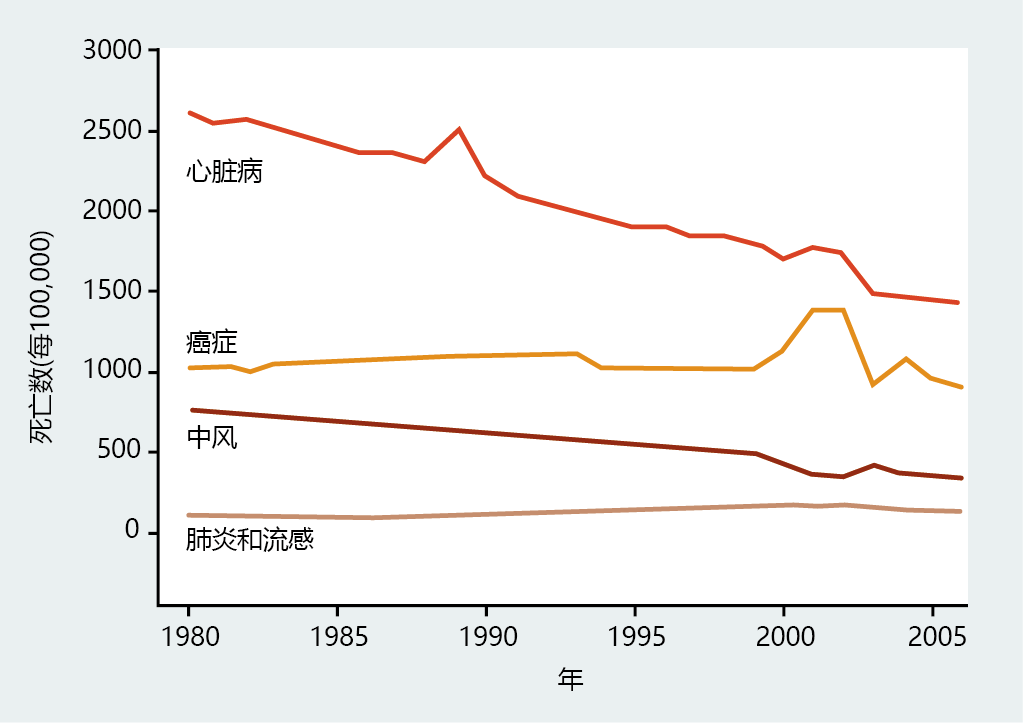
For example, in 1930, the number of years a person could expect to live after age 65 was a little over 12 years (Figure 7.10). In 2010, those over the age of 65 could expect to live an additional 18.1 years. The increase in life span after age 65 reflects, for the most part, the ability to treat noninfectious, life-threatening diseases such as heart disease and cancer. For instance, since its peak in 1980, mortality from coronary heart disease in the over-65 age group has fallen by almost 40%, from a high of 2500/100,000 to 1400/100,000 (Figure 7.11). Factors accounting for this decrease include improved diagnostic procedures (early detection of coronary heart disease), prophylactic measures such as angioplasty and arterial stents, and replacement of coronary arteries (bypass surgery). That is, individuals who, 40 years ago, would have died due to lack of effective treatment are now able to enjoy a long, healthy life span (BOX 7.1).
Figure 7.10 Age-specific life expectancy in the United States at 65 and 85 years of age. (From F.C. Bell and M.L. Miller, Life tables for the United States Social Security area 1900–2100, Washington, DC: Social Security Administration, 2005, p. 194.)
Figure 7.11 Death rates for the four leading causes of death in individuals over the age of 65. Deaths due to heart disease, the perennial leading cause of death, have declined by slightly more than 40% since 1980. This decline in heart disease has resulted in the significant gains in life expectancy at 65+ seen in Figure 7.10. (From National Center for Health Statistics.)
| BOX 7.1 BIOLOGY MEETS SOCIOLOGY: FUNDING SOCIAL SECURITY |
|
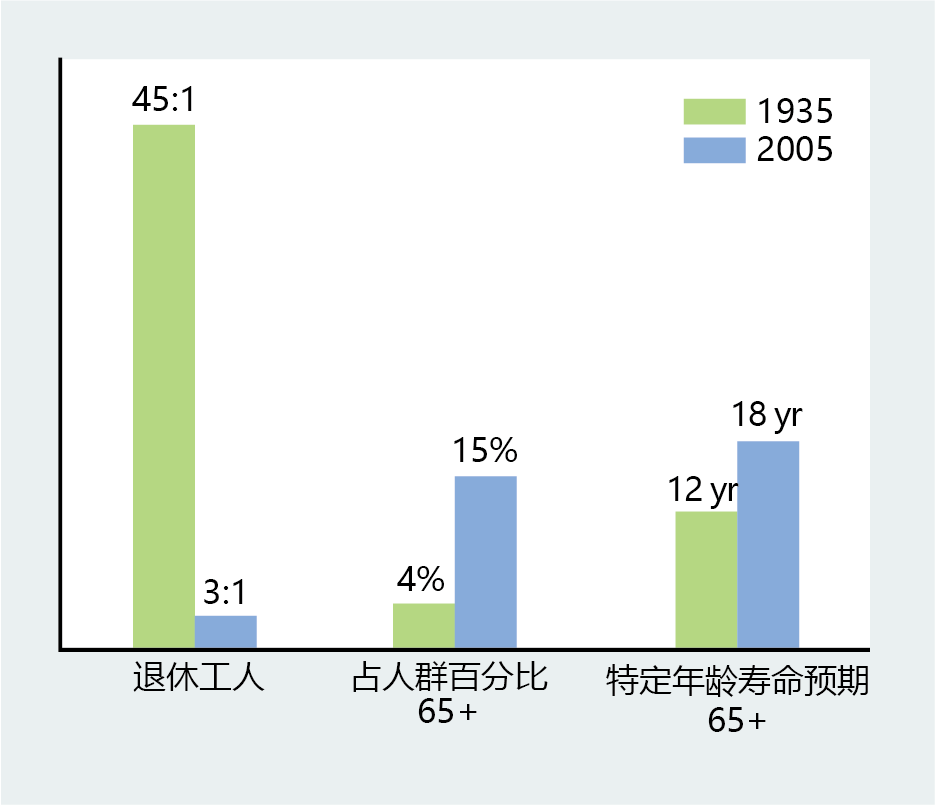
Before getting your first formal job, one in which you were paid by payroll check rather than with cash, you most likely had to provide your employer with your Social Security number and to begin paying into the Social Security system, so that someday you'll be eligible for retirement benefits. Many individuals in the baby boomer generation, those born between 1940 and 1960, take the Social Security system for granted and will, most likely, collect all the retirement benefits due to them when they reach retirement age. Subsequent generations may not be as lucky, as questions have been raised concerning the solvency of the Social Security Trust Fund. Some even call the Social Security funding dilemma a “crisis.” To understand why the retirement benefits of Social Security may be in trouble, we only have to look at the changes in mean life span during the twentieth century. The Social Security system came into being in 1935 as a part of President Roosevelt's New Deal economic recovery program. The idea was to lessen the financial burden on the family's primary wage earner for care of elderly family members. This was to be accomplished by establishing a system in which the federal government would tax workers to pay for their retirement. The underlying theory was that, because the ratio of workers to retirees was so great, the current workers (the young) could pay for the retired generation. Each successive generation would be expected to do the same. Moreover, the tax structure for Social Security was set up to include additional money to fund a trust that would defray expenses during times of economic downturns and low tax revenues. In 1935 the theory made sense, because of three important demographic facts: (1) the proportion of individuals over the age of 65, the designated retirement age, was 4% of the total population—a value that had remained constant throughout most of history; (2) the ratio of workers to retirees was 45:1; and (3) the age-specific life expectancy at 65 was 12 years (Figure 7.12). That is, at any one time, very few people (as a proportion of the population) were eligible for receiving Social Security benefits, there were plenty of workers to pay for those who did retire, and the payout period was relatively short. Today, however, 15% of the population is eligible to apply for Social Security, the worker-to-retiree ratio is approaching equality, and retirees will remain eligible for benefits, on average, for almost 20 years (see Figure 7.12). Thus, we are asking a smaller group of workers to pay for an increasing number of retirees who may live a significant portion of their total life span in retirement. Figure 7.12 Variables affecting the Social Security Trust Fund.
The math tells us everything: the change in demographics, with the increase in the aging population, has placed significant pressure on our ability to adequately ensure a solvent Social Security system for individuals born today. Finding solutions to the coming financial difficulties in Social Security will not be easy and will require significant action by our political representatives. In this battle there is only one certainty: the percentage of individuals living long, healthy lives will continue to increase. |
7.2.5 Women have a longer life expectancy than men
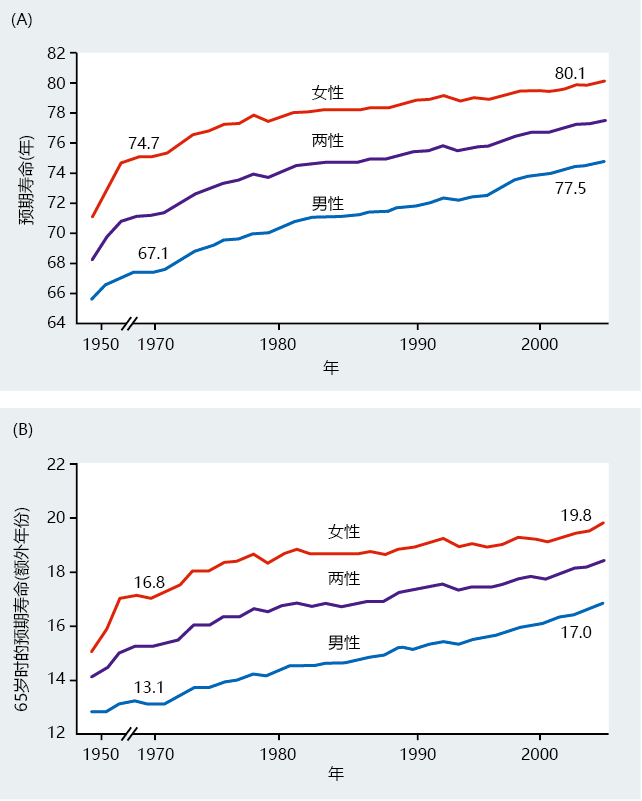
For most of the twentieth century, females born in economically developed countries outlived males, creating a “gender gap” in mean life span (Figure 7.13). Reasons given for the gender gap are many, including genetic factors that favor females, but none of the explanations have been shown to be a direct cause. Plausible explanations are those suggesting that the gender gap is, for the most part, a uniquely human trait and reflects modifiable factors—that is, things we do to ourselves. Human males tend to participate more than females in behaviors that lead to greater rates of certain diseases. For example, from 1940 to 1985, the number of men who smoked cigarettes was almost double the number of women who smoked. This caused significantly greater early-age (40–60 years) mortality from heart disease and lung cancer in men than in women.
Figure 7.13 The “gender gap” in life expectancy at birth and at age 65. The difference in mean life span between men and women has been decreasing steadily since accurate recordkeeping began (~1950). (A) The difference in life expectancy at birth between men and women in 1970 was 7.6 years. By 2003, the difference had declined to 2.6 years. (B) A similar pattern of decrease in the gender gap can be seen in life expectancy after the age of 65.
Homo sapiens appears to be one of only a handful of species that have a significant post-reproductive life span and show mean life-span differences between males and females. Several, but not all, studies have shown that no other mammals with long post-reproductive life spans show a gender difference.
While genetic factors accounting for the human gender gap cannot be ruled out, it seems unlikely that biological variation alone could explain the difference in longevity in males and females. At least two facts argue strongly against a purely biological explanation. First, biological differences at the genetic level that would account for gender differences in mean life span cannot be supported by the evolutionary theory of longevity. That is, genes are selected for reproduction, not longevity, and mortality rates for men and women during the reproductive years do not differ. Second, if genes rather than environmental factors underlie the difference in mean life spans, we would not expect to see changes in the gender gap. In fact, this gender gap has been narrowing steadily since 1950 (and perhaps longer; records of gender differences in longevity are unreliable). For example, as shown in Figure 7.13, a male born in 1950 could expect to live 65 years, whereas a female had a mean life expectancy at birth of 71 years, a gap of 6 years. By 2003, the gap was only 2.7 years. The narrowing of the gender gap was caused by a 13.4% gain in mean life span for men, compared with a modest 6.7% gain for women. Genetic differences would persist, for the most part, regardless of environmental stimuli.
ESSENTIAL CONCEPTS
- Biodemography combines the classical techniques of demography—mortality analysis—with the biological principles of longevity. Biodemography is primarily a mathematical and theoretical science that constructs models predicting the origins of human longevity.
- Humans respond to environmental changes on the basis of cognitive reasoning and thus can change the environment to fit their needs, rather than instinctively allowing the environment to control their longevity.
- A population contains many subpopulations with distinctive mortality rates, and such subpopulations have had a significant influence on the origins of human longevity. Biodemographers refer to human mortality rates as facultative.
- Biodemographers suggest that the different genotypes resulting in different mortality rates could have existed throughout evolutionary history and may have influenced the selection of genes that determine human longevity.
- The origin of longevity in Homo sapiens may result from our advanced intelligence, which allows us to adapt the environment to our genes and thus change mortality characteristics.
- Archeological evidence indicates that from the Neolithic Period (~5000 b. c. e.) to the Enlightenment (~1600 c. e.), the average human life span remained fairly stable at 30–40 years. • Widespread inoculation programs and the control of infectious diseases increased life expectancy dramatically in the early twentieth century.
- In the economically developed countries, the increase in life expectancy at birth after 1970 reflects improvements in care and treatment for noninfectious, life-threatening diseases in older age groups.
- Throughout the twentieth century, females born in the developed countries had a greater life expectancy at birth than males The gender gap in longevity is now narrowing, due to signifi- cantly greater gains in mean life span for men than for women.
本章结束


