9.6 TIME-DEPENDENT DISEASE OF ENDOCRINE SYSTEM: TYPE 2 DIABETES MELLITUS
Diabetes mellitus is caused by the inability of cells to take up glucose. Alterations in glucose uptake are due either to insufficient insulin secretion by the pancreas (type 1 diabetes mellitus) or to cells developing a resistance to the action of insulin (type 2 diabetes mellitus). Type 1 diabetes develops primarily in individuals under the age of 10 years and is regarded as an autoimmune disorder but also has genetic and viral components. Type 2 diabetes usually develops after the age of 40 and has an environmental basis, although some genetic factors have been identified. Here, we focus exclusively on type 2 diabetes.
Insulin resistance is a precursor to type 2 diabetes
Insulin resistance reflects the inability of insulin to effectively induce glucose uptake by liver, muscle, and adipose tissue when insulin secretion remains normal. The American Diabetes Association defines insulin resistance (also known as glucose intolerance) as when the “body does not use insulin properly.” In general, there are three criteria that establish the presence of type II diabetes. This includes a fasted (at least 8 hours) blood glucose between 100 and 125 mg/dL. If the fasted value is above 126 mg/dL, the health-care worker may request an oral glucose tolerance test (OGTT). The OGTT consists of measuring blood glucose concentration in a fasted state and then administering an oral dose of glucose (75 g) mixed in flavored water. Six to ten additional blood glucose measurements are taken over the next 2 hours. Individuals with a blood glucose concentration between 140 and 199 mg/dL at the end of a 2-hour OGTT are considered prediabetic (Figure 9.32). Those above 200 mg/dL after 2 hours are diagnosed with type 2 diabetes.
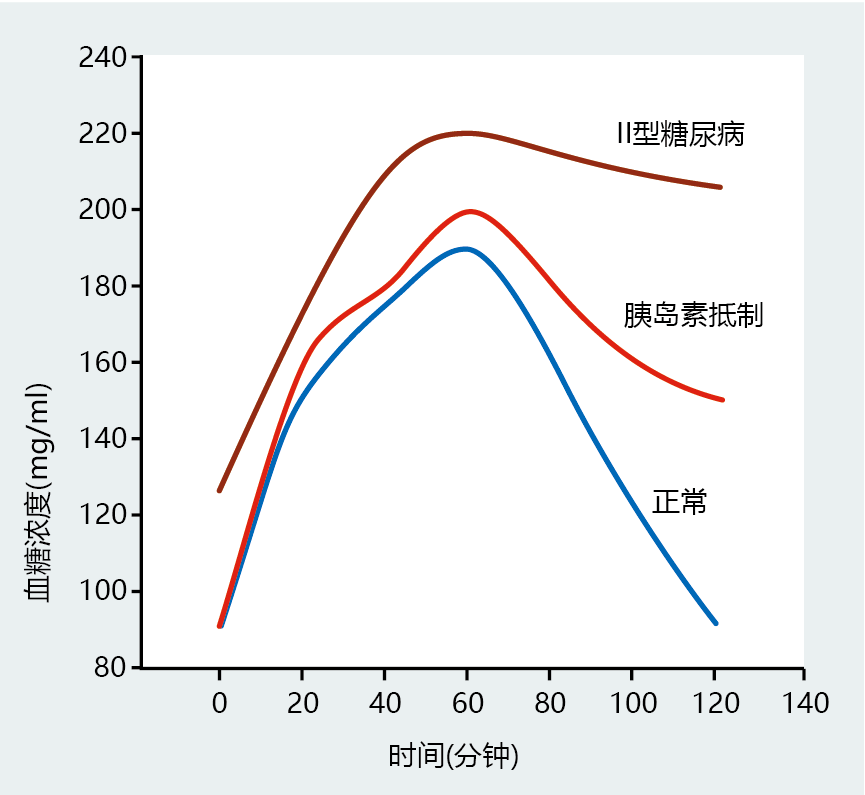
Figure 9.32 Oral glucose tolerance test results for individuals with normal insulin function, insulin resistance, and type 2 diabetes.
In recent years, a third diagnostic criterion for type 2 diabetes, the level of glycosylated hemoglobin A1c (or just A1c), has been added as an indication of plasma glucose concentration over extended periods. Recall our discussion of the nonenzymatic glycosylation of proteins in Chapter 8. Since nonenzymatic glycosylation has no catabolic pathway, once a protein has been glycosylated, it remains that way over its life span. Nondiabetic individuals with an average resting blood glucose level below 120 mg/dL have blood concentrations of glycosylated hemoglobin below 6.5% of the total blood hemoglobin concentration. Individuals whose long-term average resting glucose concentration exceeds 120 mg/dL have an A1c level above 6.5%. For people with diabetes, A1c level also provides a convenient and easy biomarker for evaluating the effectiveness of treatment aimed at regulating blood glucose levels.
The underlying mechanisms of insulin resistance have not been fully described, and most of our current knowledge about the effect of age on impaired glucose tolerance comes from animal studies. In general, the number and affinity of insulin receptors seem to remain unchanged throughout the life span. Only limited information exists on the effect of aging on postreceptor signal transduction. Although the intracellular concentration of GLUT4 does not change, the amount of this transporter found at the membrane during periods of increased blood glucose concentration declines significantly in older animals. Decreased translocation of the GLUT4 protein to the cell membrane surface attenuates the uptake of glucose into the cell and thus results in increased blood glucose concentration. Without therapeutic intervention or alteration in lifestyle, insulin resistance can progress to type 2 diabetes.
Type 2 diabetes impairs microvascular blood flow
Uncontrolled type 2 diabetes can lead to, or often leads to, several complications, including cardiovascular disease, neuropathy, nephropathy, and retinopathy. The mechanisms underlying development of the complications associated with type 2 diabetes have yet to be established, but a reduction in the amount of blood reaching cells is regarded as one important potential contributing factor. Loss of appropriate blood flow to tissue reflects, in large part, a decrease in the microvasculature's compliance properties that is due to increased glycosylation of connective tissue. Without the ability of blood vessels to contract and expand in response to changes in cardiac output, tissue does not receive the appropriate amount of blood and thus oxygenation of the tissue is impaired. Attenuated oxygenation lowers the rate of ATP production, which, in turn, limits many intracellular reactions, leading to cell dysfunction and cell death.
The decrease in blood flow and subsequent damage to sensory neurons provides a good example of how type 2 diabetes can result in significant tissue damage. Imagine that an individual with type 2 diabetes and sensory neuron damage steps on a small piece of glass. The sensory neurons fail to signal the brain that a wound has occurred on the bottom of the foot. The individual does not perceive pain and fails to take appropriate action to remove the glass or clean the wound. An effort to remove the glass and attend to the wound is particularly important for individuals with type 2 diabetes, because normal inflammation and immune system mechanisms are diminished due to decreased blood flow. Without appropriate “cleansing” of the wound by the immune system, the individual is at significantly greater risk for infection. An untreated infection could result in widespread necrosis, gangrene, and the need for amputation of the limb.
Altered glucose metabolism may increase cell damage in people with type 2 diabetes
The kidney, retina, and neurons do not require insulin for glucose uptake; glucose moves freely into the cells. In individuals with normal blood glucose concentration, glucose entering these cells is used exclusively for immediate energy needs (glycolysis) or for potential energy (glycogenesis). However, in diabetes, blood glucose concentrations are well above the amount required to meet the energy demands of the cell. The excess glucose can activate an alternative pathway that leads to an accumulation of compounds that are not easily metabolized. This pathway, the polyol pathway, converts glucose to fructose via the production of sorbitol (Figure 9.33). Sorbitol and fructose have the potential to alter cellular metabolism and increase cellular damage. Given its hydrophilic nature, sorbitol (an alcohol) cannot diffuse through the membrane, and it accumulates in the cell. The resulting osmotic stress disrupts normal membrane potential and slows or stops many intracellular reactions. Moreover, the reduction of glucose to sorbitol reduces the concentration of reduced nicotinamide adenine dinucleotide phosphate (NADPH+H+), an electron carrier important in maintaining the intracellular concentration of reduced glutathione (GSH). Reduced glutathione protects cell membranes against the formation of lipid peroxides by scavenging the hydroxyl radical (•OH). Fructose, a sugar normally found at very low concentrations in the cell, forms advanced glycation end products 100 times more effectively than does glucose. Thus, the polyol pathway has the potential to increase the already high rate of protein glycosylation observed in type 2 diabetes.
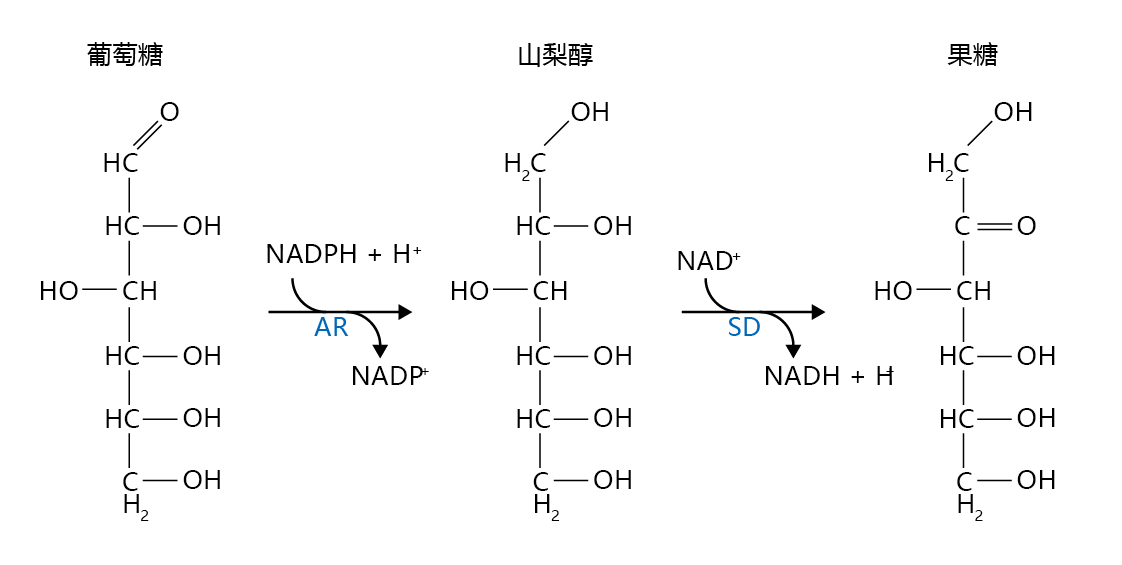
Figure 9.33 The polyol pathway. When the intracellular glucose concentration exceeds the cell's energy requirements, aldose reductase (AR) can catalyze the reduction of glucose to sorbitol, with hydrogen ions donated by reduced NADP (NADPH+H+). Sorbitol dehydrogenase (SD) catalyzes the oxidation of sorbitol to fructose by donating the hydrogen ions to NAD+.
The increased activity of the polyol pathway has been shown to induce retinopathy in type 2 diabetic dogs, an excellent model for human diabetes. These findings led many clinical research teams to test drugs that inhibit aldose reductase as a means of controlling sorbitol/fructose-induced damage. Unfortunately, investigations in laboratory animals and humans have produced only limited success. That is, aldose reductase inhibitors reduced the activity of the polyol pathway, but retinopathy did not decline. Research is currently underway to evaluate other drugs that inhibit the formation of fructose through the polyol pathway.
Risk factors for diabetes include increasing age, obesity, and genetic background
The cause of type 2 diabetes in the elderly population remains unknown. Several factors have been identified that place elderly individuals at risk for developing type 2 diabetes. These factors include age, obesity, lack of physical activity, and genetics/family history. All appear to play primary roles and often occur together. The percentage of individuals diagnosed with type 2 diabetes increases with age in all age groups (Figure 9.34). Moreover, the prevalence of type 2 diabetes in the 45–64 and 65+ age groups has increased by more than 50% since 1980. Although the reason for the rise in new cases of type 2 diabetes remains unknown, the increase in incidence of obesity over the same period must be suspected as contributing significantly to the incidence of this disease (Figure 9.35). Indeed, most experts now believe that obesity accounts for 80% of all new cases of type 2 diabetes (BOX 9.2).
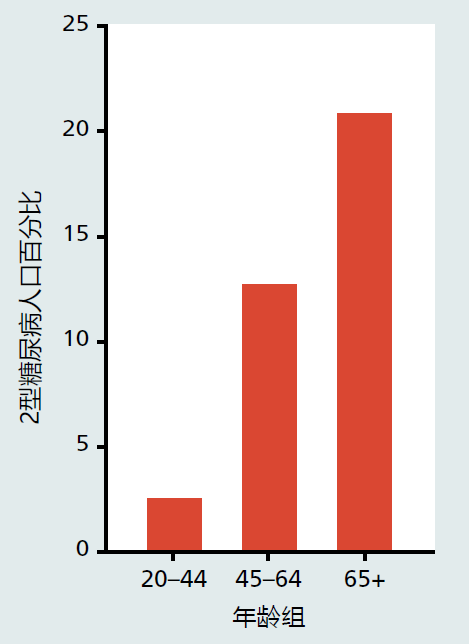
Figure 9.34 Prevalence of type 2 diabetes in the adult population, United States. (Data from National Center for Health Statistics, Health, United States. 2010. With Special Feature on Death and Dying. Hyattsville, MD: Centers for Disease Control and Prevention, 2011.)
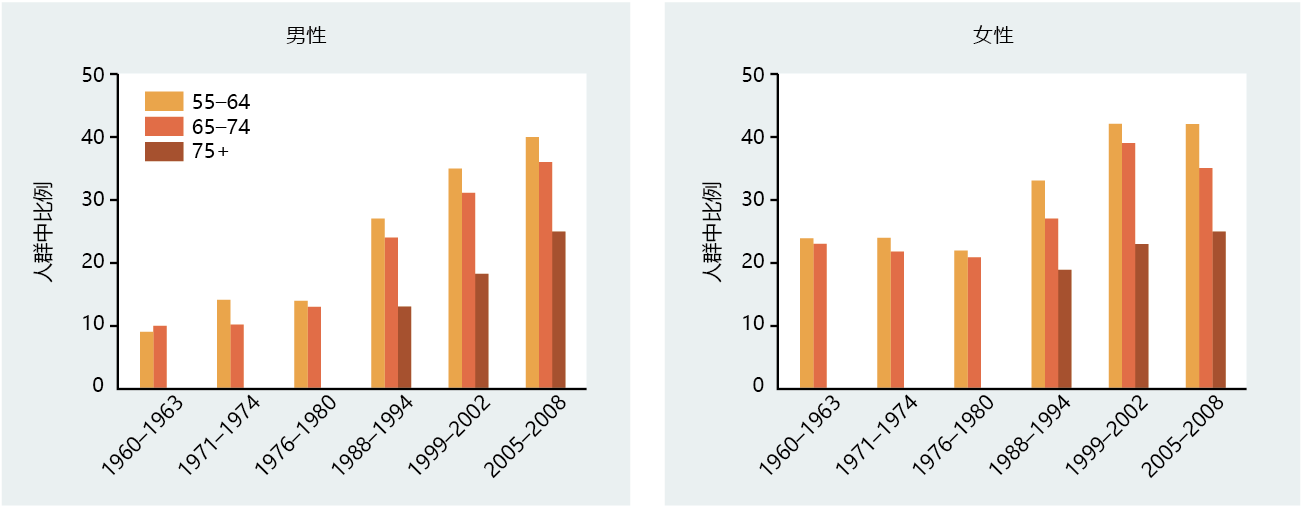
Figure 9.35 Prevalence of obesity in men and women, United States. Obesity is defined as BMI > 30. Data for individuals older than 75 years were not collected before 1988. (Data from National Center for Health Statistics, Health, United States. 2010. With Special Feature on Death and Dying. Hyattsville, MD: Centers for Disease Control and Prevention, 2011.)
|
BOX 9.2 OBESITY AND TYPE 2 DIABETES: THE DIABETES PREVENTION PROGRAM RESEARCH GROUP STUDIES |
|
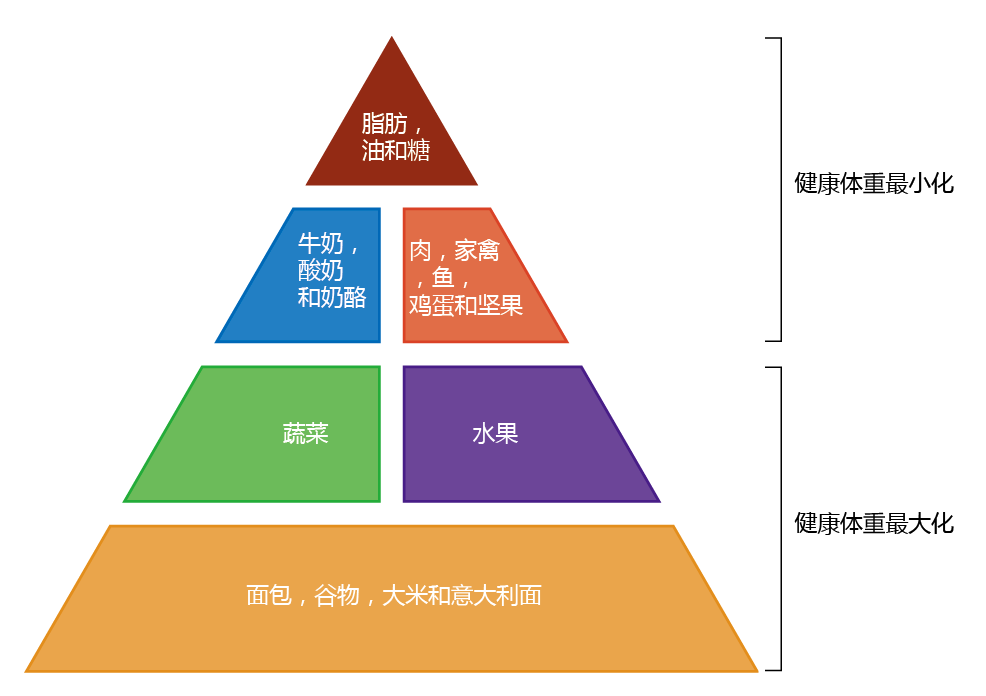
Advancing age significantly increases the incidence of type 2 diabetes. The percentage of individuals 65 years and older who had type 2 diabetes was close to 8% in the United States from the time accurate records began (1975) until the early 1990s. Then the percentage of the population 65 years of age and older who were diagnosed with type 2 diabetes began to increase, with the current number standing at ∼18%. Interestingly, the rate of obesity in the older population also began to increase at about the same time. This correlation led many researchers to suggest that obesity might have a significant role in the etiology of type 2 diabetes. Physicians have long recognized the relationship between obesity and type 2 diabetes, but the standard dietary recommendations, such as the Food Guide Pyramid (Figure 9.36), have proved ineffective in reducing the body weight of obese individuals. The rates of both obesity and type 2 diabetes continued to climb throughout the 1990s and into the new century. On the bright side, the introduction in 1994 of a new class of drugs, the biguanides, allowed the effective management of blood glucose levels without causing significant side effects. Complications due to uncontrolled blood glucose concentrations in people with type 2 diabetes started to decline. However, biguanides such as metformin (Glucophage) were being used to treat, but not prevent, type 2 diabetes. Many health professionals remained convinced that prevention was a better option than treatment for most insulin-resistant patients. Moreover, several respected nutritionists were suggesting that weight loss programs more aggressive than those recommended by the national health groups (USDA, NIH, etc.) should be used to prevent obesity and thereby reduce the incidence of type 2 diabetes.
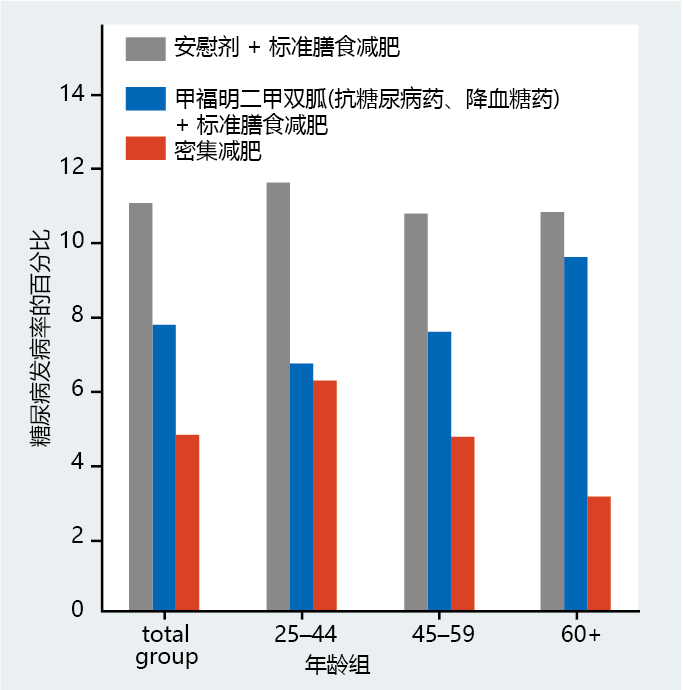
Figure 9.36 Food Guide Pyramid. The U.S. Department of Agriculture (USDA), the developer of this food pyramid, suggests that following these dietary recommendations will help to maintain or achieve a healthy weight. Several small studies on human subjects have shown that type 2 diabetes could be prevented by reducing weight below the obesity standard (BMI < 30), but large clinical trials were needed to verify the data. To this end, researchers from 29 independent centers throughout the United States joined together to test whether reducing obesity in insulin-resistant individuals would prevent the development of type 2 diabetes. The research group, named the Diabetes Prevention Program Research Group, recorded the incidence of new cases of type 2 diabetes over a 4-year period in male and female glucose-intolerant individuals of various ages and racial/ethnic backgrounds. The individuals were divided into groups to receive one of three treatments: (1) 850 mg doses of metformin (a biguanide) plus standard dietary recommendations as outlined in the Food Guide Pyramid; (2) standard dietary recommendations plus a placebo; or (3) an intensive weight loss program designed to reduce body weight by 7% through increased physical activity and a low-calorie diet. The results were simply remarkable (Figure 9.37). The weight lost by individuals in the intensive weight loss group was substantially greater than that of individuals who followed the standard dietary recommendations. Individuals in the intensive weight loss program lost an average of 5.6 kg of body weight in 4 years. Those following the standard weight loss recommendations and receiving placebo did not show any weight loss during the same period; those in the metformin group lost an average of 2.6 kg. Likewise, the incidence of type 2 diabetes in the intensive weight loss group was 58% lower than that in the group following standard dietary recommendations and taking placebo. The metformin treatment prevented the development of type 2 diabetes better than did the placebo, but it was far less effective than the intensive weight loss. In fact, metformin did not reduce the incidence of type 2 diabetes in individuals aged 60 or older; only the intensive weight loss group showed a significant reduction in type 2 diabetes incidence in the 60 and older group.
|
There is also a genetic link. Several studies have shown that where obesity is not involved, the development of type 2 diabetes runs in families, especially in individuals of Asian or African descent. Estimates of the genetic contribution to type 2 diabetes vary, but most experts agree that 10%–20% of type 2 diabetes cases have a genetic link. The genetic link might be part of a more general condition known as metabolic syndrome, which increases the risk for several diseases, including coronary heart disease, stroke, and diabetes. Metabolic syndrome is characterized by high levels of blood triglycerides and LDLs, low levels of HDLs, hypertension, and a resting blood glucose level of 120–135 mg/dL. It is unlikely that metabolic syndrome reflects a mutation in a gene or gene group. Rather, like type 2 diabetes, metabolic syndrome most often appears in individuals who have some alteration in regulating fat metabolism (obesity) and a sedentary lifestyle.


